


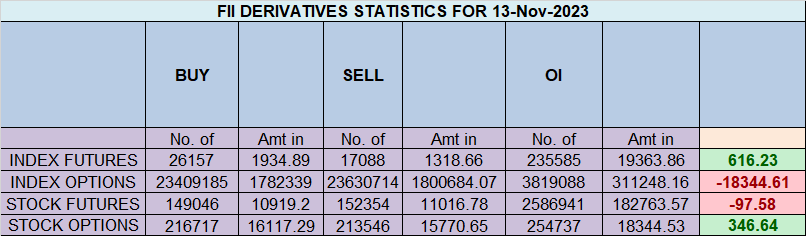
Analysis of FIIs’ behavior in the Nifty Index Futures market shows a Bullish approach as they displayed a preference for LONG positions. On a net basis, FIIs went LONG 622 contracts worth 60 crores, resulting in an decrease of 2496 contracts in the Net Open Interest.
We have Mercury Ingress today, as discussed in the video below, and we anticipate an opening with a gap down. Gann Price Time Symmetryas discussed in below is still valid as price is still not able to close above 19470 . Mercury has Highest influence on Nifty due to Reliance Weightage. Clear trigger levels are outlined for both the buy and sell sides.
Always remember, trading is about probability, not certainty.
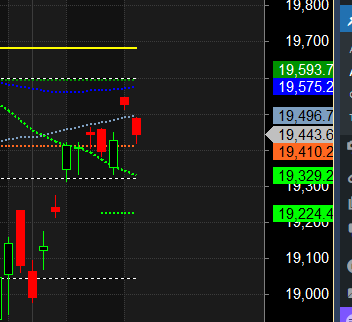
Nifty is at its 40 trading days from 15 Sep High of 20222 simple gann technique as discussed in below video. Bulls need to close above 19555 today for upmove to continue towards 19729/19850. Watch out for first 15 mins high and low to capture trend for the day.

Nifty Trade Plan for Positional Trade ,Bulls will get active above 19470 for a move towards 19529/19610. Bears will get active below 19321 for a move towards 19224/19108. Nifty formed a Double top pattern at Gann 62.5 % retracement level.
Traders may watch out for potential intraday reversals at 9:29, 11:27,12:23,2:00,2:45 How to Find and Trade Intraday Reversal Times
Nifty Nov Futures Open Interest Volume stood at 1.13 lakh cr , witnessing a addition of 3.6 lakh contracts. Additionally, the increase in Cost of Carry implies that there was a closeure of LONG positions today.
Nifty Advance Decline Ratio at 34:16 and Nifty Rollover Cost is @19372 closed below it.
Nifty Gann Monthly Trend Change Level : 19224
Nifty is near its 20 DMA, Fight on to close above 19410-19455 zone. Any break of 19410 will lead to fall towards 19320
Nifty options chain shows that the maximum pain point is at 19600 and the put-call ratio (PCR) is at 0.95. Typically, when the PCR open interest ranges between 0.90 and 1.05, the market tends to remain range-bound.
Nifty 50 Options Chain Analysis
The Nifty 50 options chain indicates that the highest open interest (OI) on the call side is at the 19600 strike, followed by 19700 strikes. On the put side, the highest OI is at the 19400 strike, followed by 19300 strikes. This suggests that the market participants are expecting Nifty 50 to remain range between 19300-19600 levels.
In the cash segment, Foreign Institutional Investors (FII) sold 1244 crores, while Domestic Institutional Investors (DII) bought 830 crores.
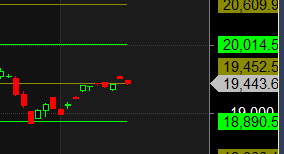
Traders who follow the musical octave trading path may find valuable insights in predicting Nifty’s movements. According to this path, Nifty may follow a path of 18890-19452-20014 This means that traders can take a position and potentially ride the move as Nifty moves through these levels.Of course, it’s important to keep in mind that trading is inherently risky and market movements can be unpredictable.
“Years of practice at the game, of constant study, of always remembering, enable the trader to act on the instant when the unexpected happens as well as when the expected comes to pass.”
For Positional Traders, The Nifty Futures’ Trend Change Level is At 19317. Going Long Or Short Above Or Below This Level Can Help Them Stay On The Same Side As Institutions, With A Higher Risk-reward Ratio. Intraday Traders Can Keep An Eye On 19499 , Which Acts As An Intraday Trend Change Level.
Nifty Intraday Trading Levels
Buy Above 19650 Tgt 19680, 19710 and 19743 ( Nifty Spot Levels)
Sell Below 19585 Tgt 19555, 19512 and 19485 ( Nifty Spot Levels)
Wishing you good health and trading success as always.As always, prioritize your health and trade with caution.
As always, it’s essential to closely monitor market movements and make informed decisions based on a well-thought-out trading plan and risk management strategy. Market conditions can change rapidly, and it’s crucial to be adaptable and cautious in your approach.