


Finance Nifty did an open High today 19574 formed an Inside Bar on Venus Ingress as discussed in below video, “Bayer Rule 14: VENUS MOVEMENTS IN GEOCENTRIC LONGITUDE USING A UNIT OF 1*9’13”” and Moon at 0 Declination are 2 important events happeing tommrow. Also price is near Gann Angle and 09 is Gann date as shown below chart. As Both Astro and Gann Date are Confluencing again we should see a trending move in next 2 days.
Happy Dhanteras to all Blog reader !!
We have Mercury Ingress today, as discussed in the video below, and we anticipate an opening with a gap down. The price is near Gann’s 1×2 angle support, and it aligns with an important Gann date. This confluence of both price and time, coupled with a DOJI formation, creates the perfect recipe for a significant move. Clear trigger levels are outlined for both the buy and sell sides.
Always remember, trading is about probability, not certainty.

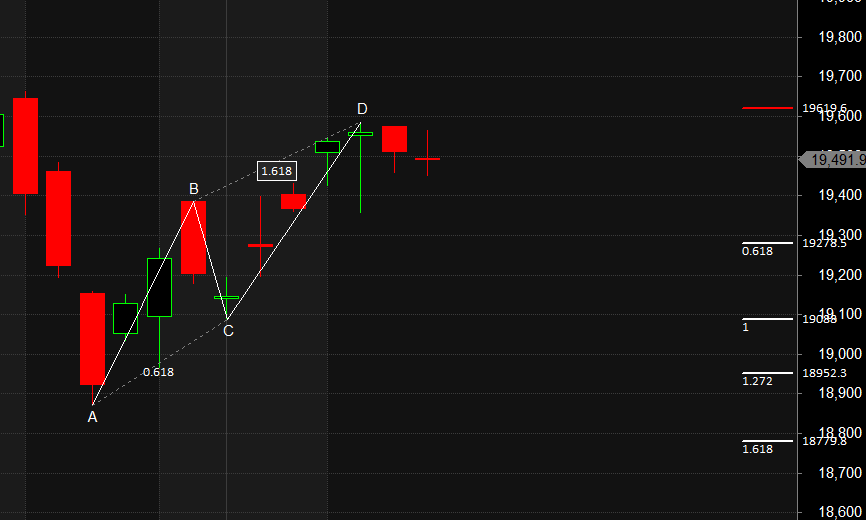
Finance Nifty Trade Plan for Positional Trade ,Bulls will get active above 19620 for a move towards 19685/19729. Bears will get active below 19425 for a move towards 19356/19250. Finance Nifty formed a tripple top pattern at Gann 62.5 % retracement level. Also formed a Bearish ABCD Harmonic Pattern having PRZ zone at 19620
Traders may watch out for potential intraday reversals at 9:28, 10:00,11:49,1:07,2:27 How to Find and Trade Intraday Reversal Times
Finance Nifty Nov Futures Open Interest Volume stood at 55920 with liquidation of 2600 contracts. Additionally, the decrease in Cost of Carry implies that there was a Covering of LONG positions today.
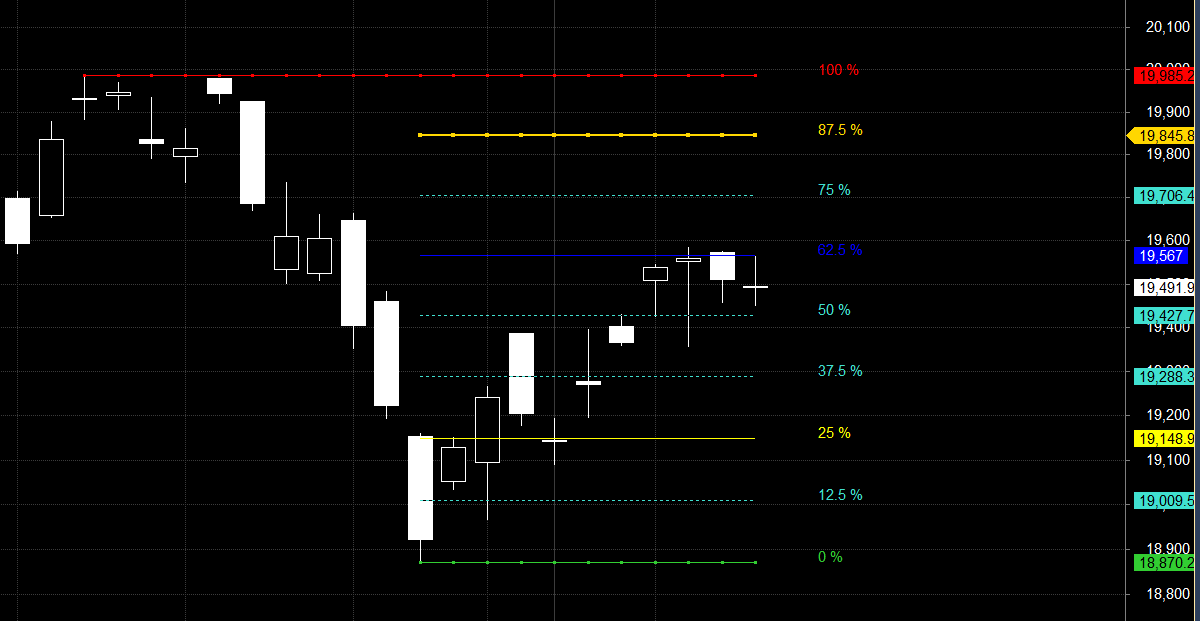
Finance Nifty Advance Decline Ratio at 10:09, Finance Nifty Rollover Cost is @19275 closed above it.
Bank Nifty Gann Monthly Trend Change Level : 43211
Finance Nifty has closed below 19500, Break of 19420 quick fall towards 19250

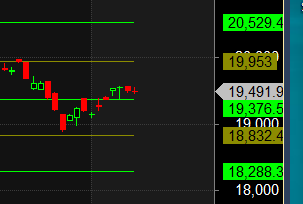
Traders who follow the musical octave trading path may find valuable insights in predicting Bank Nifty’s movements. According to this path, Finance Nifty may follow a path of 18832-19376-19953 . This means that traders can take a position and potentially ride the move as Bank Nifty moves through these levels. Of course, it’s important to keep in mind that trading is inherently risky and market movements can be unpredictable. Price has taken closed above 19376
According to the Finance Nifty options chain, the call side has the highest open interest (OI) at the 19550 strike, followed by the 19650 strike. On the put side, the 19450 strike has the highest OI, followed by the 19400 strike. This indicates that market participants anticipate Finance Nifty to stay within the 19400-19600 range.
The Finance Nifty options chain shows that the maximum pain point is at 19500 and the put-call ratio (PCR) is at 0.88 . Typically, when the PCR open interest ranges between 0.90 and 1.05, the market tends to remain range-bound.
“Years of practice at the game, of constant study, of always remembering, enable the trader to act on the instant when the unexpected happens as well as when the expected comes to pass.”
For Positional Traders, The Finance Nifty Futures’ Trend Change Level is At 19435 . Going Long Or Short Above Or Below This Level Can Help Them Stay On The Same Side As Institutions, With A Higher Risk-reward Ratio. Intraday Traders Can Keep An Eye On 19598 , Which Acts As An Intraday Trend Change Level.
Intraday Trading Levels for Finance Nifty
Buy Above 19512 Tgt 19535, 19566 and 19600 ( Finance Nifty Spot Levels)
Sell Below 19435 Tgt 19400, 19366 and 19333 (Finance Nifty Spot Levels)
Wishing you good health and trading success as always.As always, prioritize your health and trade with caution.
As always, it’s essential to closely monitor market movements and make informed decisions based on a well-thought-out trading plan and risk management strategy. Market conditions can change rapidly, and it’s crucial to be adaptable and cautious in your approach.