


Analysis of FIIs’ behavior in the Nifty Index Futures market shows a Bearish approach as they displayed a preference for SHORT positions. On a net basis, FIIs went SHORT 4455 contracts worth 432 crores, resulting in an increase of 3487 contracts in the Net Open Interest. Additionally, they bought 6342 long contracts and covered 3271 short contracts, indicating a strategy of adding long positions and covering of short positions. Till Date FII’s are covered 27405 Long and added 899 SHORT and Retailers are long 34312 contracts and covered 27334 contracts.
The NR21 pattern, as the name suggests, refers to a trading situation where the range of price movement over a specific period is exceptionally narrow. Specifically, the range should be the smallest within the past 21 trading sessions.
The significance of the number 21 lies in its representation of a trading month, considering the typical number of trading days. Traders use this period to identify the tightest range within which price has moved.
The NR21 pattern signifies a state of market compression, where volatility is notably reduced. This reduction in price range is often indicative of a period of indecision among traders.
NIfty Bears got stopped out and Bulls were not able to close above 19472 and formed an Outside Bar pattern, Today we will open Gap up BUlls need to cross 19530-19555 range for upmove to continue. Any close below 19400 Bears will be back with a Bang.
Nifty Trade Plan Bulls will get active above 19525 for a move towards 19577/19630/19683. Bears will get active below 19450 for a move towards400/19351/19302
Traders may watch out for potential intraday reversals at 9:21,10:58,11:46,12:47,2:20 How to Find and Trade Intraday Reversal Times
Nifty July Futures Open Interest Volume stood at 0.97 lakh, witnessing a liquidation of 2.5 lakh contracts. Additionally, the increase in Cost of Carry implies that there was a covering of SHORT positions today.
Nifty Advance Decline Ratio at 30:20 and Nifty Rollover Cost is @19860 and Rollover is at 73.9 %.
Nifty has going back towards its 20 SMA @19529

Nifty options chain shows that the maximum pain point is at 19500 and the put-call ratio (PCR) is at 0.91 . Typically, when the PCR open interest ranges between 0.90 and 1.05, the market tends to remain range-bound.
Nifty 50 Options Chain Analysis
The Nifty 50 options chain indicates that the highest open interest (OI) on the call side is at the 19500 strike, followed by 19600 strikes. On the put side, the highest OI is at the 19300 strike, followed by 19200 strikes. This suggests that the market participants are expecting Nifty 50 to remain range between 19400-19600 levels.
According To Todays Data, Retailers Have bought 11.9 K Call Option Contracts And 138 K Call Option Contracts Were Shorted by them. Additionally, They bought 176 K Put Option Contracts And 136 K Put Option Contracts were Shorted by them, Indicating A BEARISH Bias.
In Contrast, Foreign Institutional Investors (FIIs) bought 8.5 K Call Option Contracts And 44.6 K Call Option Contracts Were Shorted by them. On The Put Side, FIIs bought 220 K Put Option Contracts And 315 K Put Option Contracts were Shorted by them, Suggesting They Have Turned To NEUTRAL Bias.
In the cash segment, Foreign Institutional Investors (FII) bought 614 crores, while Domestic Institutional Investors (DII) bought 125 crores.
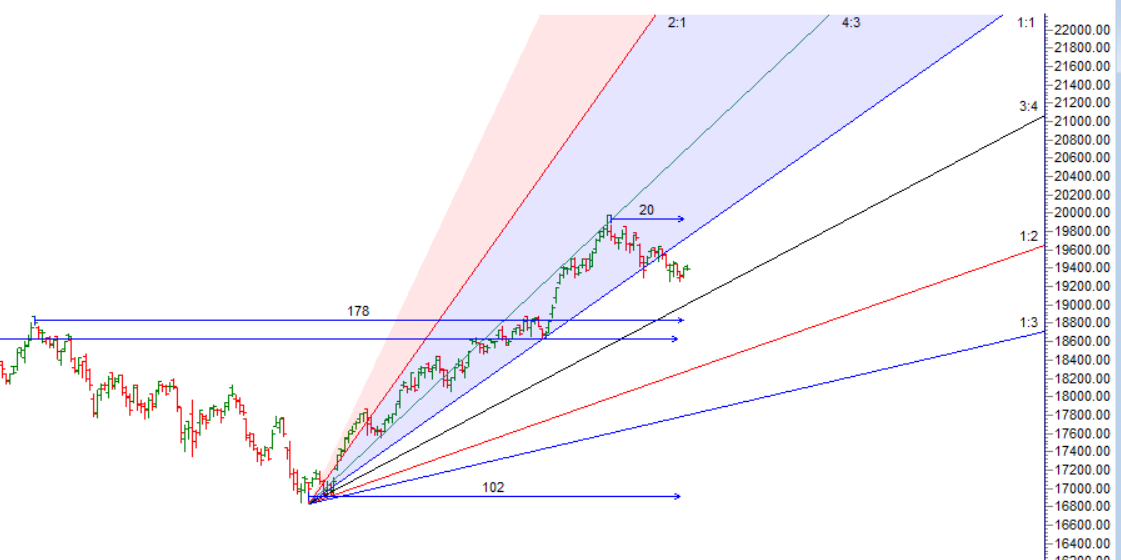
Traders who follow the musical octave trading path may find valuable insights in predicting Nifty’s movements. According to this path, Nifty may follow a path of 18890-19452-20014 This means that traders can take a position and potentially ride the move as Nifty moves through these levels.Of course, it’s important to keep in mind that trading is inherently risky and market movements can be unpredictable.Price has closed below 19452 4 days in a row

One of the most important attributes of a professional trader is the willingness to accept full responsibility for one’s actions. One can never improve if every mistake is the broker’s, or the fault of the data vendor, or the software.
For Positional Traders, The Nifty Futures’ Trend Change Level is At 19558 . Going Long Or Short Above Or Below This Level Can Help Them Stay On The Same Side As Institutions, With A Higher Risk-reward Ratio. Intraday Traders Can Keep An Eye On 19415 , Which Acts As An Intraday Trend Change Level.
Intraday Trading Levels
Buy Above 19525 Tgt 19555, 19595 and 19639 (Nifty Spot Levels)
Sell Below 19450 Tgt 19416, 19385 and 19333 (Nifty Spot Levels)
Upper End of Expiry : 19639
Lower End of Expiry : 19400
Wishing you good health and trading success as always.As always, prioritize your health and trade with caution.
As always, it’s essential to closely monitor market movements and make informed decisions based on a well-thought-out trading plan and risk management strategy. Market conditions can change rapidly, and it’s crucial to be adaptable and cautious in your approach.