


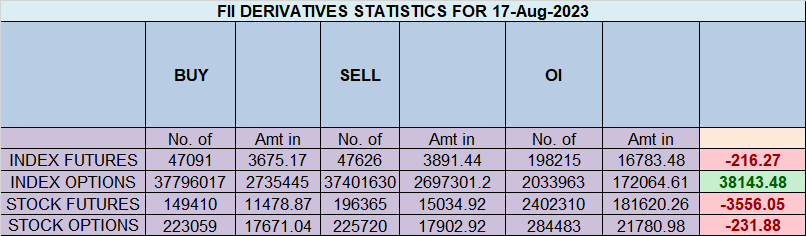
Analysis of FIIs’ behavior in the Nifty Index Futures market shows a Bullish approach as they displayed a preference for LONG positions. On a net basis, FIIs went Long 5202 contracts worth 506 crores, resulting in an increase of 334 contracts in the Net Open Interest. Additionally, they bought 1118 long contracts and added 239 short contracts, indicating a strategy of adding long positions and adding of short positions. Till Date FII’s are covered 37812 Long and added 7811 SHORT.
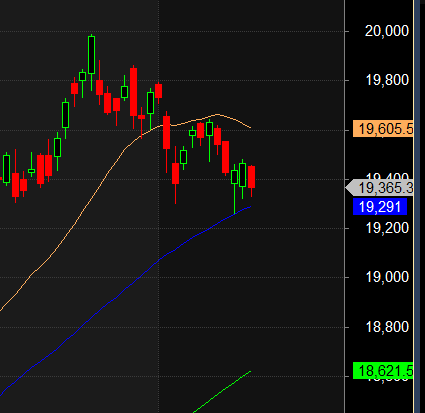
Nifty from past 2 days have been opening gap down but the gap is getting filled and closing in green. Now today we have an important astro date as discussed in below video, Till Bulls are able to hold 19410 We can see relief rally toward19555/19610 , Any break of 19345 can see fast fall towards 19275/19166.
For me, the defining observation comes from the equities. So far, in this series, FII have sold equities worth 12384 crore and 19529 crore in Stock Future . DII have bought equities worth 13028 ,DII includes all Indian Institutions. If you go a bit deeper and observe, the difference between FII selling and DII buying is getting more pronounced in the last 2-3 days. The first large difference came on 11 th August, when the difference is around 2500 crore. That day, nifty was at psychologically important level of 19500 . The difference is becoming pronounced again in the last 2-3 days where nifty is at another important psychological level of 19300 .
Equity buying/selling is delayed cycle to the FnO cycle. First FII take Short positions in FnO – Then they will start Selling equities to induce a Fall – and then they will start liquidating the FnO Shorts.
Nifty formed an INSIDE BAR today with price struggling near 50 DMA, on Weekly chart we will be forming 4 red candel in row, Bulls would like to close around19400-19424 tommrow and bears would like to close around 19250-19274 range for a big move next week as multiple astro dates are coming.
 Nifty Trade Plan Bulls will get active above 19505 for a move towards 19575/19645. Bears will get active below 19435 for a move towards 19365/19295/19225 — Waiting for 19295/19225
Traders may watch out for potential intraday reversals at 10:31,11:20,12:03,2:06,2:46 How to Find and Trade Intraday Reversal Times
Nifty July Futures Open Interest Volume stood at 1.10 lakh, witnessing a addition of 2.9 lakh contracts. Additionally, the increase in Cost of Carry implies that there was a addition of SHORT positions today.
Nifty Advance Decline Ratio at 17:33 and Nifty Rollover Cost is @19860 and Rollover is at 73.9 %.
Nifty has bounced from 50 SMA @19291 ,Once we close below 19290 heading towards 19108/19000
Nifty options chain shows that the maximum pain point is at 19300 and the put-call ratio (PCR) is at 0.92 . Typically, when the PCR open interest ranges between 0.90 and 1.05, the market tends to remain range-bound.
Nifty 50 Options Chain Analysis
The Nifty 50 options chain indicates that the highest open interest (OI) on the call side is at the 19500 strike, followed by 19600 strikes. On the put side, the highest OI is at the 19300 strike, followed by 19200 strikes. This suggests that the market participants are expecting Nifty 50 to remain range between 19200-19500 levels.
In the cash segment, Foreign Institutional Investors (FII) sold 1510 crores, while Domestic Institutional Investors (DII) sold 313 crores.
Traders who follow the musical octave trading path may find valuable insights in predicting Nifty’s movements. According to this path, Nifty may follow a path of 18890-19452-20014 This means that traders can take a position and potentially ride the move as Nifty moves through these levels.Of course, it’s important to keep in mind that trading is inherently risky and market movements can be unpredictable.Price has closed below 19452 2 days in a row

One of the most important attributes of a professional trader is the willingness to accept full responsibility for one’s actions. One can never improve if every mistake is the broker’s, or the fault of the data vendor, or the software.
For Positional Traders, The Nifty Futures’ Trend Change Level is At 19605 . Going Long Or Short Above Or Below This Level Can Help Them Stay On The Same Side As Institutions, With A Higher Risk-reward Ratio. Intraday Traders Can Keep An Eye On 19402 , Which Acts As An Intraday Trend Change Level.
Intraday Trading Levels
Buy Above 19375 Tgt 19400, 19424 and 19485 (Nifty Spot Levels)
Sell Below 19330 Tgt 19307, 19266 and 19225 (Nifty Spot Levels)
Wishing you good health and trading success as always.As always, prioritize your health and trade with caution.
As always, it’s essential to closely monitor market movements and make informed decisions based on a well-thought-out trading plan and risk management strategy. Market conditions can change rapidly, and it’s crucial to be adaptable and cautious in your approach.