


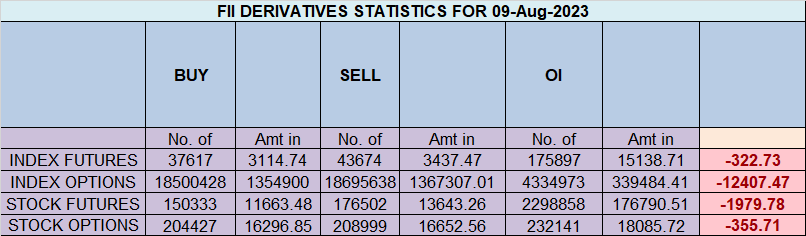
Analysis of FIIs’ behavior in the Nifty Index Futures market shows a Bulish approach as they displayed a preference for LONG positions. On a net basis, FIIs went LONG 2773 contracts worth 271 crores, resulting in an decrease of 1899 contracts in the Net Open Interest. Additionally, they sold 5438 long contracts and added 619 short contracts, indicating a strategy of closing long positions and adding of short positions.
As Discussed in Last Analysis
Nifty has formed the third higher high and higher low on the daily chart, For Bulls to maintain control, a close above 19650 is crucial. Failure to achieve this could lead Bears to drive the price back down towards 19410.
Gann’s emphasis on the number 3 is noteworthy, and if today’s high isn’t breached and considering the astrological observation mentioned in Bayer Rule 27, which indicates that significant tops and major bottoms can occur when Mercury’s speed in Geocentric longitude is at 59 minutes or 1 degree 58 minutes, there is a possibility of a decline in till 19410 Nifty if the closing price remains below 19650.
Nifty saw a dip today based on our yesterday analysis and fall stopped at 19470 which is 25% retracement of currnet move as shown below , and we saw a decent recovery in 2 half of the session. TOmmrow we have RBI Policy and price is back towards its octave point at 19644. Todays rally was more of short covering. Tommrow Mercury at Greatest Elong: 27.4°E and Mercury at Aphelion as Mercury has big impact on Nifty so first 15 mins High and Low will guide for the day.
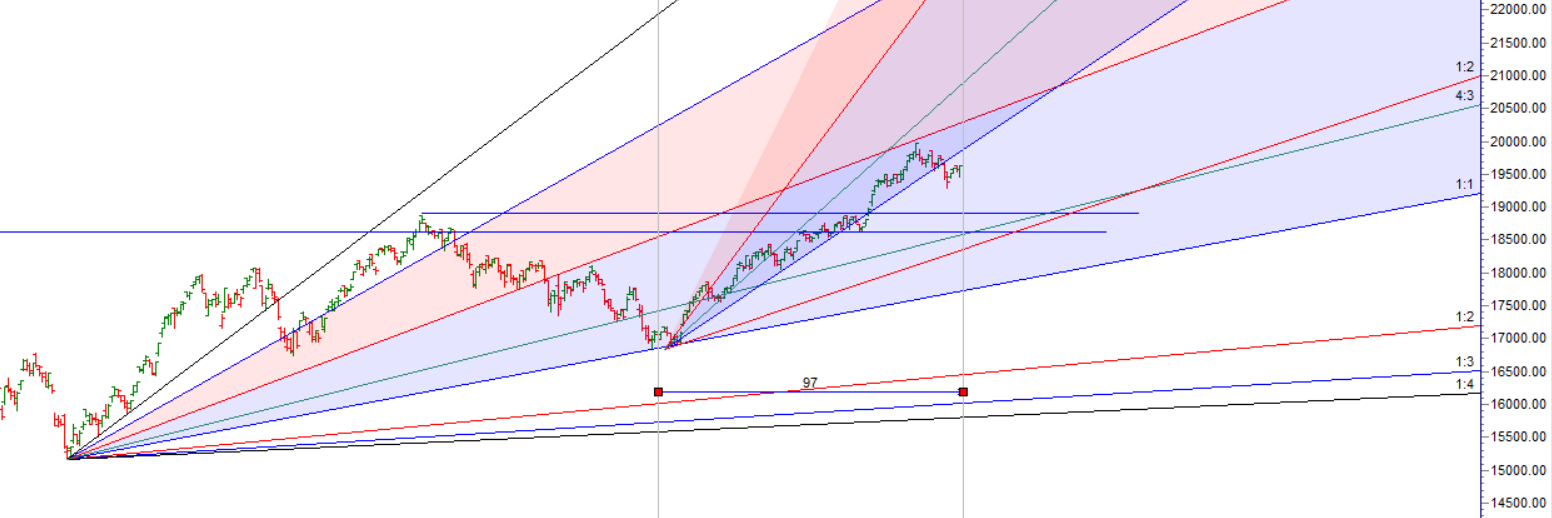
Nifty Bulls need to move above 19644 which is Octave point , Unable to do that fall can extend of 19557/19470/19383.

Traders may watch out for potential intraday reversals at 9:17,11:50,12:52,2:34 How to Find and Trade Intraday Reversal Times
Nifty July Futures Open Interest Volume stood at 1.02 lakh, witnessing a liquidation of 7.4 lakh contracts. Additionally, the increase in Cost of Carry implies that there was a covering of LONG positions today.
Nifty Advance Decline Ratio at 33:16 and Nifty Rollover Cost is @19860 and Rollover is at 73.9 %.
Nifty has baack to its 20 SMA support at 19657.

Nifty options chain shows that the maximum pain point is at 19600 and the put-call ratio (PCR) is at 1.11. Typically, when the PCR open interest ranges between 0.90 and 1.05, the market tends to remain range-bound.
Nifty 50 Options Chain Analysis
The Nifty 50 options chain indicates that the highest open interest (OI) on the call side is at the 19700 strike, followed by 19800 strikes. On the put side, the highest OI is at the 19500 strike, followed by 19400 strikes. This suggests that the market participants are expecting Nifty 50 to remain range between 19400-19700 levels.
According To Todays Data, Retailers Have bought 336 K Call Option Contracts And 377 K Call Option Contracts Were Shorted by them. Additionally, They bought 438 K Put Option Contracts And 366 K Put Option Contracts were Shorted by them, Indicating A BEARISH Bias.
In Contrast, Foreign Institutional Investors (FIIs) bought 86.8 K Call Option Contracts And 123 K Call Option Contracts Were Shorted by them. On The Put Side, FIIs sold 68.7 K Put Option Contracts And 7.9 K Put Option Contracts were Shorted by them, Suggesting They Have Turned To NEUTRAL Bias.
In the cash segment, Foreign Institutional Investors (FII) bought 644 crores, while Domestic Institutional Investors (DII) sold 597 crores.
Traders who follow the musical octave trading path may find valuable insights in predicting Nifty’s movements. According to this path, Nifty may follow a path of 18890-19452-20014 This means that traders can take a position and potentially ride the move as Nifty moves through these levels.Of course, it’s important to keep in mind that trading is inherently risky and market movements can be unpredictable.Price has bounced from 19452

To make One Good Trade you must prepare properly, work hard, and have patience
For Positional Traders, The Nifty Futures’ Trend Change Level is At 19672. Going Long Or Short Above Or Below This Level Can Help Them Stay On The Same Side As Institutions, With A Higher Risk-reward Ratio. Intraday Traders Can Keep An Eye On 19599, Which Acts As An Intraday Trend Change Level.
Intraday Trading Levels
Buy Above 19600 Tgt 19636, 19666 and 19699 (Nifty Spot Levels)
Sell Below 19520 Tgt 19485, 19444 and 19400 (Nifty Spot Levels)
Upper End of Expiry : 19545
Lower End of Expiry : 19380
Wishing you good health and trading success as always.As always, prioritize your health and trade with caution.
As always, it’s essential to closely monitor market movements and make informed decisions based on a well-thought-out trading plan and risk management strategy. Market conditions can change rapidly, and it’s crucial to be adaptable and cautious in your approach.