


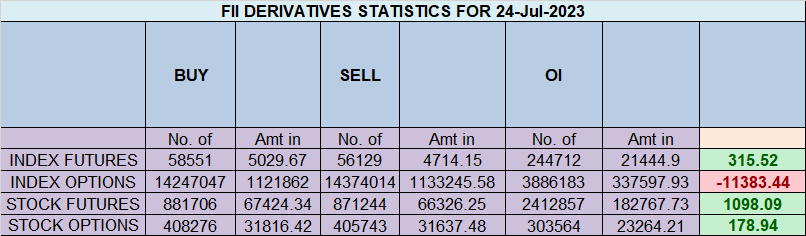
Analysis of FIIs’ behavior in the Nifty Index Futures market shows a Bullish approach as they displayed a preference for Long positions. On a net basis, FIIs went long 4,968 contracts worth 315 crores, resulting in an increase of 820 contracts in the Net Open Interest. Additionally, they sold 1635 long contracts and covered 4057 short contracts, indicating a strategy of covering long positions and covering short positions.
The FII Long Short Ratio currently stands at 64.3 %, and the FII Long to Short Ratio is at 2.18, indicating that FIIs have substantially reduced their positions in the market and have utilized the market fall to exit long positions and exit short positions in Nifty Futures. This behavior suggests a bearish sentiment among FIIs, potentially influencing the overall market sentiment and trend. Traders and investors should closely monitor these FII activities and adjust their trading strategies accordingly to adapt to the changing market conditions.
Nifty experienced its first decline of more than 1% in the last 3 months. The price was unable to touch the previous day’s high and closed below the previous day’s low. We currently have Venus and Chiron in retrograde and Sun Ingress on Saturday and Sunday, which suggests that the first 15 minutes of trading on Monday will be crucial for setting the trend for the entire day.
The market is facing conflicting forces, with IT stocks showing weakness while Financial stocks, particularly ICICI Bank, reported a great set of numbers. Reliance disappointed with its O2C business performance, adding to the tug of war between bulls and bears. However, if there is a 15-minute close below 19,682, bears are likely to gain momentum and drive the market lower.
Nifty made a lower low after DOJI on Frtiday, ICICI Bank/reliance results were unable to move nifty suggesting we are seeing distribution at higher levels and price can head towards 1×2 around 19410 gann angle as shown in below chart.

Nifty Bulls and Bears will fight for 19647 as its 50% of current rally as shown below.
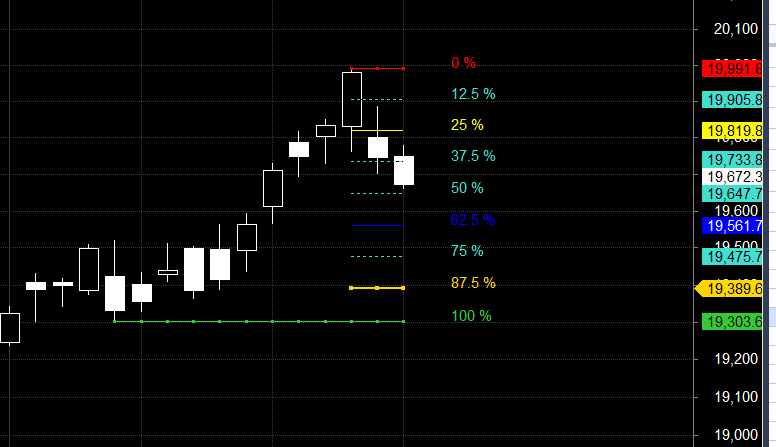
Price has closed bel;ow 19682

Traders may watch out for potential intraday reversals at 9:15,12:10,1:33,2:23 How to Find and Trade Intraday Reversal Times
Nifty July Futures Open Interest Volume stood at 0.85 lakh, witnessing a liquidation of 13.6 lakh contracts. Additionally, the increase in Cost of Carry implies that there was a covering of LONG positions today.
Nifty Advance Decline Ratio at 12:38 and Nifty Rollover Cost is @18884 and Rollover is at 69.7 %.
Nifty options chain shows that the maximum pain point is at 19700 and the put-call ratio (PCR) is at 0.94. Typically, when the PCR open interest ranges between 0.90 and 1.05, the market tends to remain range-bound.
Nifty 50 Options Chain Analysis
The Nifty 50 options chain indicates that the highest open interest (OI) on the call side is at the 19800 strike, followed by 19900 strikes. On the put side, the highest OI is at the 19700 strike, followed by 19600 strikes. This suggests that the market participants are expecting Nifty 50 to remain range between 19600-19900 levels.
According To Todays Data, Retailers Have bought 155 K Call Option Contracts And 133 K Call Option Contracts Were Shorted by them. Additionally, bought 622 K Put Option Contracts And 641 K Put Option Contracts were Shorted by them, Indicating A Bullish Outlook.
In Contrast, Foreign Institutional Investors (FIIs) bought 96 K Call Option Contracts And 203 K Call Option Contracts Were Shorted by them. On The Put Side, FIIs bought 78 K Put Option Contracts And 97 K Put Option Contracts were Shorted by them, Suggesting They Have Turned To A BEARISH Bias.
In the cash segment, Foreign Institutional Investors (FII) sold 82 crores, while Domestic Institutional Investors (DII) bought 934 crores.
Traders who follow the musical octave trading path may find valuable insights in predicting Nifty’s movements. According to this path, Nifty may follow a path of 18890-19452-20014 This means that traders can take a position and potentially ride the move as Nifty moves through these levels.Of course, it’s important to keep in mind that trading is inherently risky and market movements can be unpredictable.Price is near 20014

To make One Good Trade you must prepare properly, work hard, and have patience
For Positional Traders, The Nifty Futures’ Trend Change Level is At 19540 . Going Long Or Short Above Or Below This Level Can Help Them Stay On The Same Side As Institutions, With A Higher Risk-reward Ratio. Intraday Traders Can Keep An Eye On 19741 , Which Acts As An Intraday Trend Change Level.
Intraday Trading Levels
Buy Above 19743 Tgt 19777, 19800 and 19856 (Nifty Spot Levels)
Sell Below 19700 Tgt 19666, 19633 and 19585 (Nifty Spot Levels)
Wishing you good health and trading success as always.As always, prioritize your health and trade with caution.
As always, it’s essential to closely monitor market movements and make informed decisions based on a well-thought-out trading plan and risk management strategy. Market conditions can change rapidly, and it’s crucial to be adaptable and cautious in your approach.
share the charts
sir can u daily or weekly neo chart just for to follow the days activity