


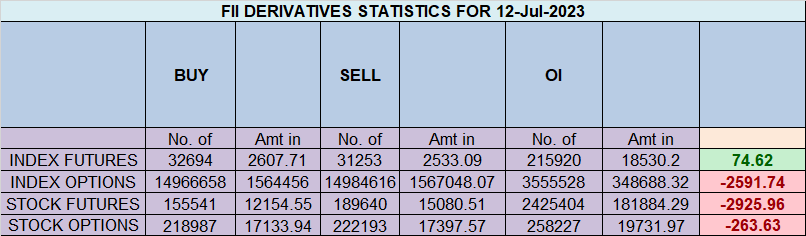
Foreign Institutional Investors (FIIs) displayed a Bearish approach in the Nifty Index Futures market by Shorting 727 contracts worth 71 crores, resulting in a increase of 3073 contracts in the Net Open Interest. FIIs bought 1807 long contracts and added 366 short contracts , indicating a preference for adding LONG and adding SHORT positions .With FII Long Short Ratio @93.9 % FII’s are heavily long in market , FIIs utilized the market rise to enter Long positions and enter short positions in NIFTY Futures.
Nifty last 2 day range is within the Friday range of 19525-19303 and formed a perfect DOJI pattern, Tommrow HCL Tech results will come so IT Index will be on limelight , US Inflation Data will come tommorow evening so carry overnight position with Hedge.
As Mars and Mercury Ingress will shown its impact, Bears need break of 19300 and BUlls need break of 19525 till not broken price can remain within the range. Based on Astro studies we should see the range breakout in next 2 session and move of 150-200 points in Nifty
NIfty formed a bearish engulfing pattern Nifty last 3 day range is within the Friday range of 19525-19303. HDFC, stopped trading on bourses post the merger with HDFC Bank that came into effect on July 1. That marks the end of a four-decade-long journey for India’s oldest mortgage lender. From Today HDFC BANK will have 14.2 % weightage in NIfty. NIfty will also react to HCL Tech and TCS Results
With US inflation coming soft NIfty will open with gap up but will it sustain the gap we will get indication with first 15 mins HIgh and low.

Nifty Trade Plan Bulls will get active above 19440 for a move towards 19490/19544/19599/19653. Bears will get active below 19325 for a move towards 19272/19218/19164.

Traders may watch out for potential intraday reversals at 9:38,11:08,1:28,2:13 How to Find and Trade Intraday Reversal Times
Nifty July Futures Open Interest Volume stood at 1.01 lakh, witnessing a addition of 0.03 lakh contracts. Additionally, the increase in Cost of Carry implies that there was a closing of LONG positions today.
Nifty Advance Decline Ratio at 18:32 and Nifty Rollover Cost is @18884 and Rollover is at 69.7 %.
Nifty options chain shows that the maximum pain point is at 19400 and the put-call ratio (PCR) is at 1.02 . Typically, when the PCR open interest ranges between 0.90 and 1.05, the market tends to remain range-bound.
Nifty 50 Options Chain Analysis
The Nifty 50 options chain indicates that the highest open interest (OI) on the call side is at the 19500 strike, followed by 19600 strikes. On the put side, the highest OI is at the 19300 strike, followed by 19200 strikes. This suggests that the market participants are expecting Nifty 50 to remain range between 19500-19300 levels.
According To Todays Data, Retailers Have bought 105 K Call Option Contracts And 82 K Call Option Contracts Were Shorted by them. Additionally, They bought 266 K Put Option Contracts And 296 K Shorted Put Option Contracts were covered by them, Indicating A BULLISH Outlook.
In Contrast, Foreign Institutional Investors (FIIs) bought 125 K Call Option Contracts And 157 K Call Option Contracts Were Shorted by them. On The Put Side, FIIs bought 69.7 K Put Option Contracts And 42 K Put Option Contracts were Shorted by them, Suggesting They Have Turned To A BEARISH Bias.
In the cash segment, Foreign Institutional Investors (FII) Sold 1242 crores, while Domestic Institutional Investors (DII) bought 436 crores.
Traders who follow the musical octave trading path may find valuable insights in predicting Nifty’s movements. According to this path, Nifty may follow a path of 18890-19452-20014 This means that traders can take a position and potentially ride the move as Nifty moves through these levels.Of course, it’s important to keep in mind that trading is inherently risky and market movements can be unpredictable.Price has closed below 19452.

With every trade I imagine that this will be my worst trade ever. And I think about it beforehand, how much of my money I want to lose with it
For Positional Traders, The Nifty Futures’ Trend Change Level is At 19394 . Going Long Or Short Above Or Below This Level Can Help Them Stay On The Same Side As Institutions, With A Higher Risk-reward Ratio. Intraday Traders Can Keep An Eye On 19491 , Which Acts As An Intraday Trend Change Level.