


Foreign Institutional Investors (FIIs) displayed a Bullish approach in the Nifty Index Futures market by Buying 6893 contracts worth 673 crores, resulting in a increase of 5635 contracts in the Net Open Interest. FIIs bought 10425 long contracts and added 1967 short contracts , indicating a preference for adding LONG and adding SHORT positions .With a Net FII Long Short ratio of 2.7 FIIs utilized the market rise to enter Long positions and enter short positions in NIFTY Futures.
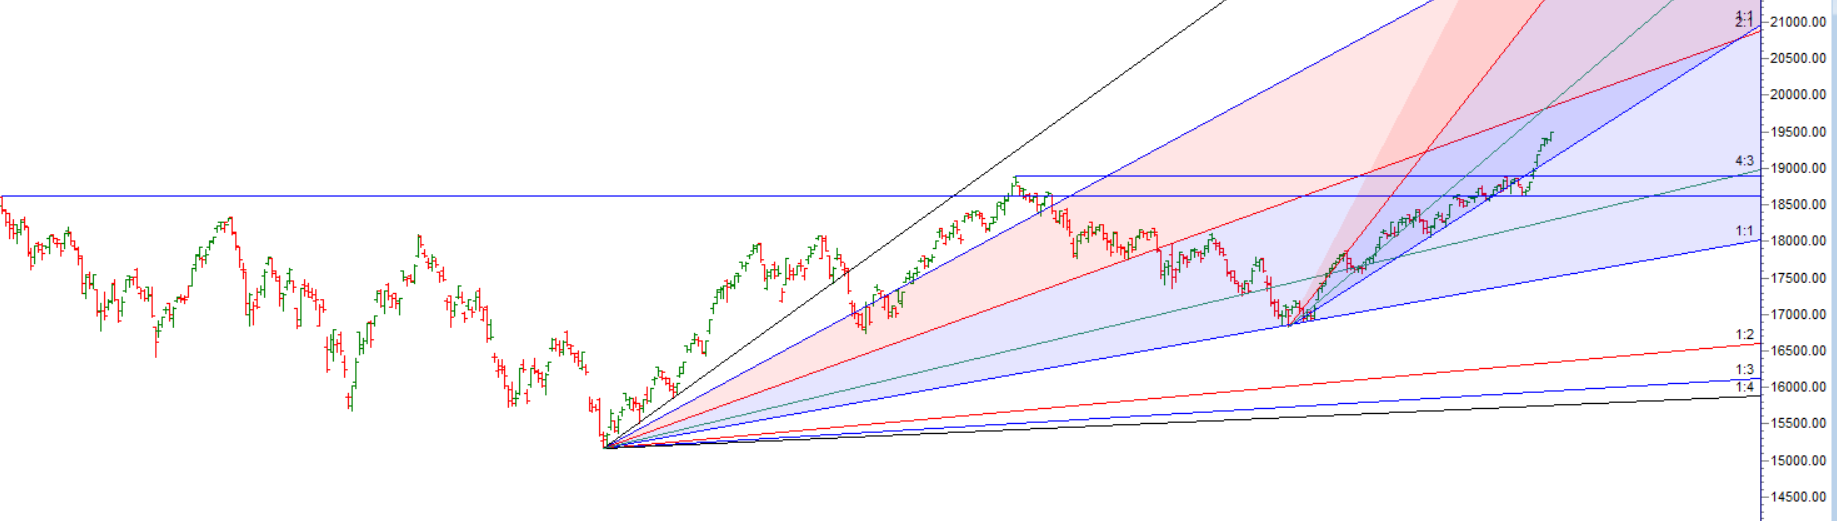
Nifty has completed 144 days since the top on December 1st, with the latest high on July 4th reaching 19434. Interestingly, this level aligns with the Gann 360-degree calculation when measured from the low of 2253 in October 2008. This convergence of price and time is known as price-time squaring, which suggests a potential significant turning point in the market.
To capitalize on this situation, it is advisable to consider fresh long positions only if Nifty surpasses the level of 19450. This would indicate further upward momentum and potentially higher prices ahead. On the other hand, fresh short positions can be considered if Nifty falls below 19300, as this could lead to a sharp decline towards the targets of 19108-19040.
It’s important to note that these levels and scenarios are based on technical analysis and historical patterns. However, the market is influenced by various factors, and it’s always prudent to use appropriate risk management strategies and stay adaptable to changing market conditions.
NIfty has made a fresh all time high today on 72 trading day from 16 March Low as discussed in below video, Mercury Sun Aspect is important aspect for Nifty as discussed in below video.
Since the low of 16828 on March 20th and the high of 16828 on till today the rally has amounted to a gain of 2684 points over 110 days. Therefore, a pullback of at least 555-729 points can be expected. If you are long in the market, it is advisable to tighten your stop-loss to the low of July 4th.
On June 9th, Bayer’s rule will come into effect. Rule No. 38 states that when Mercury is in this specific motion, significant tops and bottoms are often formed.
Nifty Trade Plan Based Bulls will get active above 19462 for a move towards 19503/19544/19585. Bears will get active below 19298 for a move towards 19257/19216/19175. — Waiting for 19544/19585, Bears will get active below 19366 for a move towards 19300/19257/19216/19175.

Traders may watch out for potential intraday reversals at 9:59,10:28,1:48,2:32 How to Find and Trade Intraday Reversal Times
Nifty July Futures Open Interest Volume stood at 1.11 lakh, witnessing a addition of 6.4 lakh contracts. Additionally, the increase in Cost of Carry implies that there was a adding of LONG positions today.
Nifty Advance Decline Ratio at 35:15 and Nifty Rollover Cost is @18884 and Rollover is at 69.7 %.
Nifty options chain shows that the maximum pain point is at 19450 and the put-call ratio (PCR) is at 1.24. Typically, when the PCR open interest ranges between 0.90 and 1.05, the market tends to remain range-bound.
Nifty 50 Options Chain Analysis
The Nifty 50 options chain indicates that the highest open interest (OI) on the call side is at the 19500 strike, followed by 19600 strikes. On the put side, the highest OI is at the 19300 strike, followed by 19200 strikes. This suggests that the market participants are expecting Nifty 50 to remain range between 19500-19300 levels.
In the cash segment, Foreign Institutional Investors (FII) bought 2134 crores, while Domestic Institutional Investors (DII) sold 785 crores.
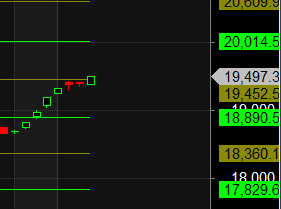
Traders who follow the musical octave trading path may find valuable insights in predicting Nifty’s movements. According to this path, Nifty may follow a path of 18890-19452-20014 This means that traders can take a position and potentially ride the move as Nifty moves through these levels.Of course, it’s important to keep in mind that trading is inherently risky and market movements can be unpredictable.Price has closed above 19452.
To create money management, position size calculation or the elaboration of a profitable set of rules. All of these very useful tools are of little help if you are not able to use them in a disciplined manner
For Positional Traders, The Nifty Futures’ Trend Change Level is At 19342. Going Long Or Short Above Or Below This Level Can Help Them Stay On The Same Side As Institutions, With A Higher Risk-reward Ratio. Intraday Traders Can Keep An Eye On 19510, Which Acts As An Intraday Trend Change Level.