


Foreign Institutional Investors (FIIs) displayed a Bullish approach in the Nifty Index Futures market by Buying 1206 contracts worth 113 crores, resulting in a decrease of 1928 contracts in the Net Open Interest. FIIs bought 2292 long contracts and bought 269 short contracts , indicating a preference for covering LONG and adding SHORT positions .With a Net FII Long Short ratio of 1.14 FIIs utilized the market fall to exit Long positions and exit short positions in NIFTY Futures.
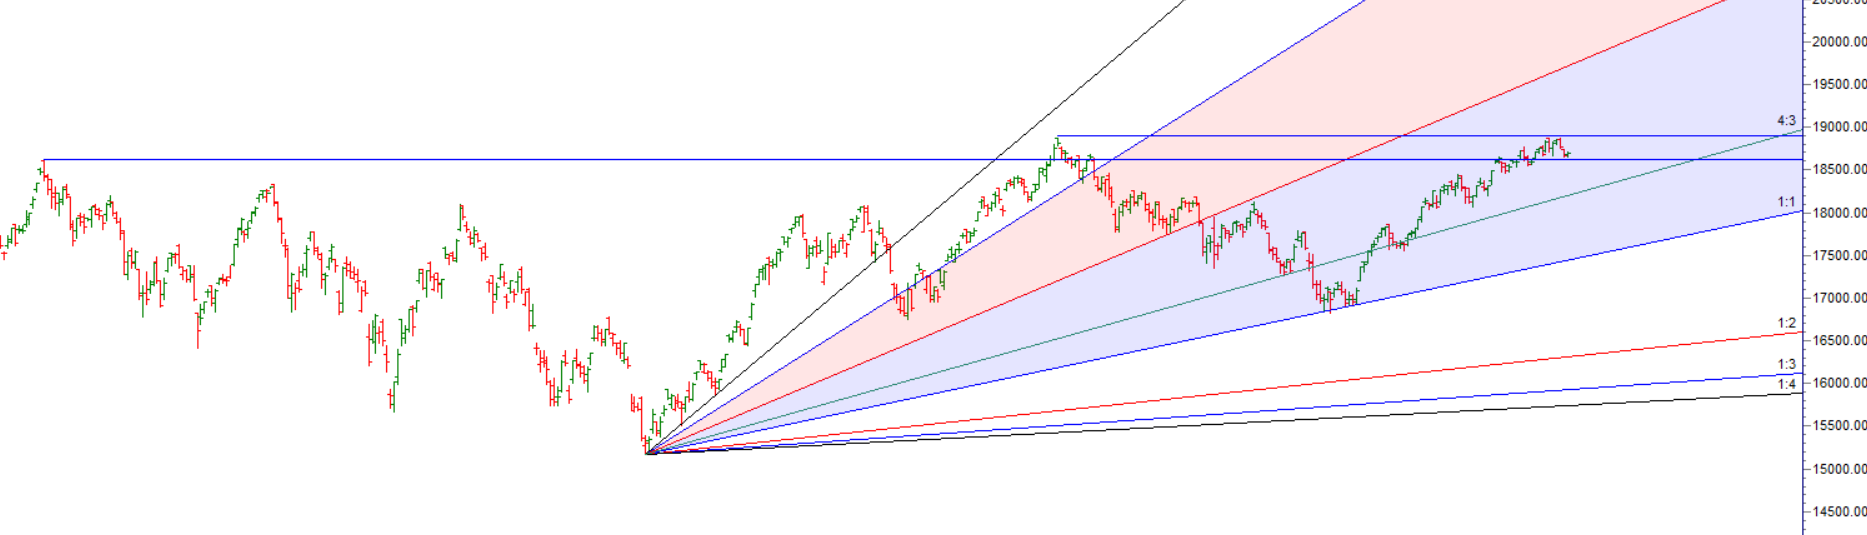
As Discussed in Last Analysis Nifty is heading towards 18604 which was previous all time high so it will act as support. ANy break of 18635-18604 range can lead to sharp dip towards 18413-18385 range. Monday we have very important Lunar Cycle which can lead to big move.
If the low price for the entire week is achieved on Friday, expect a much lower price next week. Nifty closing at the low of the week.Monday very imp Lunar Cycle can see a big move !! Direction first 15 mins High and Low.
Nifty has closed below Saturn Retrograde Low and Summer Solstice low Suggesting weakness is on the charts
We have Mercury Ingress tommrow as discuused in below video so we could see a possible range expansion with Multiple Astro and Gann date of 66 days coming. When gann and astro combine leads to big move as per past data.
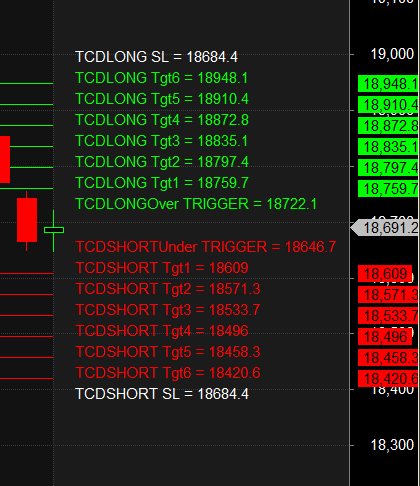
Nifty Trade Plan Based Bulls will get active above 18722 for a move towards 18759/18797/18835/18872/18910. Bears will get active below 18646 for a move towards 18609/18571/1853/18496.
Traders may watch out for potential intraday reversals at 9:15,11:08,12:11,1:27,2:22 How to Find and Trade Intraday Reversal Times
Nifty June Futures Open Interest Volume stood at 0.72 lakh, witnessing a liquidation of 12.6 lakh contracts. Additionally, the increase in Cost of Carry implies that there was a addition of SHORT positions today.
Nifty Advance Decline Ratio at 35:14 and Nifty Rollover Cost is @18407 and Rollover is at 66.8%.
Major Support for Nifty us at 18672 @ 20 SMA closed above it, Break of 18672 can lead to fall towards 18331 @ 50 SMA

Nifty options chain shows that the maximum pain point is at 18700 and the put-call ratio (PCR) is at 1.06. Typically, when the PCR open interest ranges between 0.90 and 1.05, the market tends to remain range-bound.
Nifty 50 Options Chain Analysis
The Nifty 50 options chain indicates that the highest open interest (OI) on the call side is at the 18700 strike, followed by 18800 strikes. On the put side, the highest OI is at the 18600 strike, followed by 18500 strikes. This suggests that the market participants are expecting Nifty 50 to remain range between 18500-18700 levels.
According To Todays Data, Retailers Have bought 853 K Call Option Contracts And 807 K Call Option Contracts Were Shorted by them. Additionally, They bought 778 K Put Option Contracts And 639 K Put Option Contracts were Shorted by them, Indicating A BEARISH Bias.
In Contrast, Foreign Institutional Investors (FIIs) bought 59.3 K Call Option Contracts And 96.7 K Call Option Contracts Were Shorted by them. On The Put Side, FIIs bought 4.9 K Put Option Contracts And 80 K Put Option Contracts were Shorted by them, Suggesting They Have Turned To BULLISH Bias.
In the cash segment, Foreign Institutional Investors (FII) sold 409 crores, while Domestic Institutional Investors (DII) bought 250 crores.
Traders who follow the musical octave trading path may find valuable insights in predicting Nifty’s movements. According to this path, Nifty may follow a path of 18360-18890-19452 This means that traders can take a position and potentially ride the move as Nifty moves through these levels.Of course, it’s important to keep in mind that trading is inherently risky and market movements can be unpredictable. Price made high of 18886 and reversed.

Fundamental of Trading : 1. Proper preparation 2. Hard work 3. Patience 4. A detailed plan before every trade 5. Discipline 6. Trade Journal 7. Replaying important trades
For Positional Traders, The Nifty Futures’ Trend Change Level is At 18711. Going Long Or Short Above Or Below This Level Can Help Them Stay On The Same Side As Institutions, With A Higher Risk-reward Ratio. Intraday Traders Can Keep An Eye On 18701 , Which Acts As An Intraday Trend Change Level.