


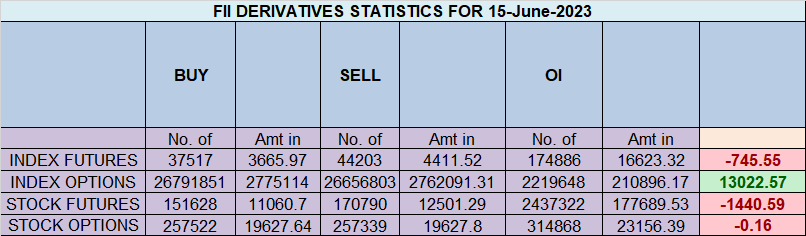
Foreign Institutional Investors (FIIs) displayed a Bullish approach in the Nifty Index Futures market by Buying 1175 contracts worth 112 crores, resulting in a incease of 8103 contracts in the Net Open Interest. FIIs bought 2171 long contracts and covered 1008 short contracts , indicating a preference for adding LONG and covering SHORT positions .With a Net FII Long Short ratio of 1.06 FIIs utilized the market fall to enter Long positions and exit short positions in NIFTY Futures.
Biporjoy cyclone will land In Gujarat , Saurastra and Kutch upto midnight 12 or so. Lets Keep the people of Affected Areas In Gujarat in Our Prayers .. Hope all will be Well !!
As Discussed in Last Analysis Another Side ways Day with Index doing Nothing and waiting for the FOMC meeting outcome.Nifty is just 100 points away from its all time high but as explained in below video lot of supply is coming and with Banks going on sideline, We are seeing a classic bulls market with sector rotation and Index Managment and Broader Market Out peforming.Till Nifty is above 18631 BUlls have upper hand.
Nifty has formed Outside Bar Pattern today till price is above 18631-18604 Bulls have upper hand ,Price action of Reliance can help in getting the next move as Jamnagar Refinery can get Impacted by Biporjoy cyclone and we can see a panic reaction.
We will be Saturn Retrograde Impact on Saturday so Monday we can see gap opening so carry overnight position with Hedge.
The Outside Bar candlestick pattern is a popular chart pattern used in technical analysis. It consists of two consecutive candles, where the second candle completely engulfs the range of the preceding candle. Here are the key characteristics of the Outside Bar pattern:
- Bullish Outside Bar: In a bullish context, the first candle is a bearish candle, followed by a larger bullish candle that engulfs the entire range of the previous candle. This pattern suggests a potential reversal from bearish to bullish momentum.
- Bearish Outside Bar: In a bearish context, the first candle is a bullish candle, followed by a larger bearish candle that engulfs the entire range of the previous candle. This pattern indicates a possible reversal from bullish to bearish momentum.
The Outside Bar pattern is considered significant because it demonstrates a shift in market sentiment. It suggests that the buyers or sellers have gained control and can potentially lead to a continuation of the newly established trend. Traders often use this pattern as a signal to enter or exit trades, depending on the direction of the pattern and the overall market conditions.
However, it’s important to remember that candlestick patterns should not be used in isolation for trading decisions. It is advisable to consider other technical indicators, price action, and fundamental analysis to confirm the signals provided by the Outside Bar pattern before making any trading decisions.

Nifty has formed an Outside Bar Pattern Bears need to break 18666 for a move towards 18606/18544/18481. Bulls need to move above 18731 for a move towards 18765/18842/18890.

Traders may watch out for potential intraday reversals at 9:18,10:57,11:27,12:54,2:58 How to Find and Trade Intraday Reversal Times
Nifty June Futures Open Interest Volume stood at 0.97 lakh, witnessing a addition of 2.4 lakh contracts. Additionally, the increase in Cost of Carry implies that there was a addition of LONG positions today.
Nifty Advance Decline Ratio at 22:28 and Nifty Rollover Cost is @18407 and Rollover is at 66.8%.
Major Support for Nifty us at 18532 @ 20 SMA

Nifty options chain shows that the maximum pain point is at 18700 and the put-call ratio (PCR) is at 0.92 . Typically, when the PCR open interest ranges between 0.90 and 1.05, the market tends to remain range-bound.
Nifty 50 Options Chain Analysis
The Nifty 50 options chain indicates that the highest open interest (OI) on the call side is at the 18700 strike, followed by 18800 strikes. On the put side, the highest OI is at the 18600 strike, followed by 18500 strikes. This suggests that the market participants are expecting Nifty 50 to remain range between 18600-18700 levels.
In the cash segment, Foreign Institutional Investors (FII) bought 3085 crores, while Domestic Institutional Investors (DII) sold 297 3 crores.
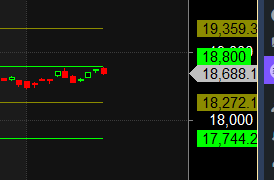
Traders who follow the musical octave trading path may find valuable insights in predicting Nifty’s movements. According to this path, Nifty may follow a path of 17744-18272-18800 This means that traders can take a position and potentially ride the move as Nifty moves through these levels.Of course, it’s important to keep in mind that trading is inherently risky and market movements can be unpredictable. Price made high of 18794 near 18800 and saw a dip.
In leveraged trades, it is how you manage risk that eventually decides if you hang on to your profits or proceed to lose it all. Therefore, traders who’ve built up substantial wealth from options do much more than setting stop-losses or using hedged strategies for their trades. Mindful of one-off events that can wipe out their hard-won capital, they sequester their capital in safe instruments, deploying only 10 or 20 per cent in trading at any given point in time. They also set limits of 2-3 per cent for the capital that they would bet on a single trade.
For Positional Traders, The Nifty Futures’ Trend Change Level is At 18668 . Going Long Or Short Above Or Below This Level Can Help Them Stay On The Same Side As Institutions, With A Higher Risk-reward Ratio. Intraday Traders Can Keep An Eye On 18790 , Which Acts As An Intraday Trend Change Level.