


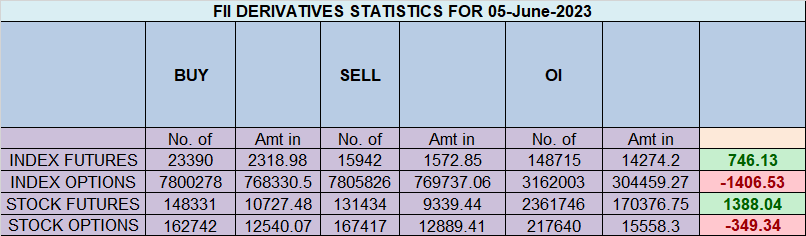
Foreign Institutional Investors (FIIs) displayed a Bullish approach in the Nifty Index Futures market by Buying 4167 contracts worth 390 crores, resulting in a increase of 6389 contracts in the Net Open Interest. FIIs bought 5988 long contracts and covered 1460 short contracts, indicating a preference for adding NEW LONG positions .With a Net FII Long Short ratio of 1 , FIIs utilized the market rise to enter Long positions and exit short positions in NIFTY Futures.
As Discussed in Last Analysis Nifty made an inside bar with multiple astro event happening on Weekend as disccused above, Also Venus is having ingress on Monday , Venus has a good impact on market and we will open gap up will be sustain gap is question. 18610 is level to watch on upside unable to cross Bears can move Index towards 20 SMA.
Venus Ingress combined with Price Pattern can lead to big move. Nifty has formed an NR21 pattern.
The NR21 pattern refers to the Narrow Range 21 pattern, a technical analysis pattern used in stock trading. It signifies a period of low volatility in the market where the price range of a particular security narrows significantly over 21 consecutive trading sessions. This pattern suggests that the market is consolidating and preparing for a potential breakout in either direction.
The NR21 pattern refers to the Narrow Range 21 pattern, a technical analysis pattern used in stock trading. It signifies a period of low volatility in the market where the price range of a particular security narrows significantly over 21 consecutive trading sessions. This pattern suggests that the market is consolidating and preparing for a potential breakout in either direction.
If the Nifty index or any other security forms an NR21 pattern, it means that the price movement has been relatively subdued over the past 21 trading sessions. Traders and investors may interpret this as a sign of indecision and expect an imminent increase in volatility. They often look for a breakout above or below the narrow range as a potential signal to enter a trade or adjust their positions accordingly.

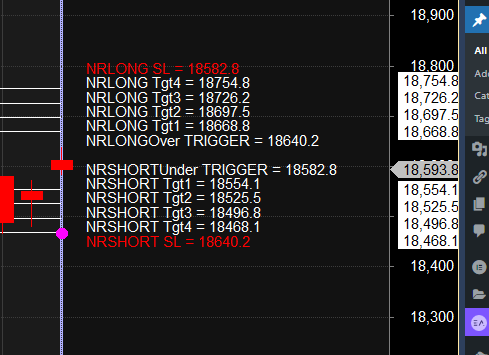
Trade Plan as per Narrow Range 21 pattern and Venus Ingres Bulls will get active above 18640 for a move towards 18697/18754 Bears will get active below 18580 for a move towards 18525/18468.
Traders may watch out for potential intraday reversals at 9:15,9:49,10:59,12:30,1:32,2:16 How to Find and Trade Intraday Reversal Times
Nifty June Futures Open Interest Volume stood at 0.91 lakh, witnessing a addition of 0.80 lakh contracts. Additionally, the increase in Cost of Carry implies that there was a addition of LONG positions today.
Nifty Advance Decline Ratio at 25:24 and Nifty Rollover Cost is @18407 and Rollover is at 66.8%.
Major Support for Nifty us at 18377 @ 20 SMA

Nifty options chain shows that the maximum pain point is at 18600 and the put-call ratio (PCR) is at 1.12. Typically, when the PCR open interest ranges between 0.90 and 1.05, the market tends to remain range-bound.
Nifty 50 Options Chain Analysis
The Nifty 50 options chain indicates that the highest open interest (OI) on the call side is at the 18600 strike, followed by 18700 strikes. On the put side, the highest OI is at the 18400 strike, followed by 18300 strikes. This suggests that the market participants are expecting Nifty 50 to remain range between 18500-18700 levels.
According To Todays Data, Retailers Have bought 639 K Call Option Contracts And 649 K Call Option Contracts Were Shorted by them. Additionally, They bought 912 K Put Option Contracts And 782 K Shorted Put Option Contracts were covered by them, Indicating A BEARISHOutlook.
In Contrast, Foreign Institutional Investors (FIIs) bought 106 K Call Option Contracts And 86 K Call Option Contracts Were Shorted by them. On The Put Side, FIIs bought 103 K Put Option Contracts And 128 K Put Option Contracts were Shorted by them, Suggesting They Have Turned To BULLISH Bias.
In the cash segment, Foreign Institutional Investors (FII) Sold 700 crores, while Domestic Institutional Investors (DII) bought 1195 crores.
Traders who follow the musical octave trading path may find valuable insights in predicting Nifty’s movements. According to this path, Nifty may follow a path of 17744-18272-18800 This means that traders can take a position and potentially ride the move as Nifty moves through these levels.Of course, it’s important to keep in mind that trading is inherently risky and market movements can be unpredictable. Price has close above 18272

Don’t overtrade. It’s tempting to trade frequently, but this can lead to losses. It’s better to trade less and focus on making high-quality trades.
For Positional Traders, The Nifty Futures’ Trend Change Level is At 18601 . Going Long Or Short Above Or Below This Level Can Help Them Stay On The Same Side As Institutions, With A Higher Risk-reward Ratio. Intraday Traders Can Keep An Eye On 18706 , Which Acts As An Intraday Trend Change Level.