


The Fed announced a rate increase while also indicating a pause. All of this was well anticipated, and thus the market’s reaction has been consistent with business as usual. Commodities sank, the US Dollar Index declined, and equity markets started to decline. However, none of those actions were unusual. By December of this year, the Fed Funds futures market was now pricing a 75–100 bps rate drop. The US central bank staff’s predictions note that a poor global economy, tighter lending restrictions, and a slowing property market are all potential causes of a mild recession. For directional traders, a range of 81.60 and 81.90/82.00 remains in play. In case prices break below 81.60 and sustain, then we can see a breakdown towards 81.20/81.00 zone on spot.
USD INR Gann Angle Chart

The price continues to get rejected from the resistance level of 83 and is taking multiple supports at the 2×1 Gann angle. USDINR remains in a range between 82 and 82.50 levels. In the event that prices break below 82 and sustain, they may test 81.50 and 81.25 levels.
USD INR Plannetary Support and Resistance Line

Indain Rupee is below Venus Plannetary line heading towards 81.50/81.25
USD INR Harmonic
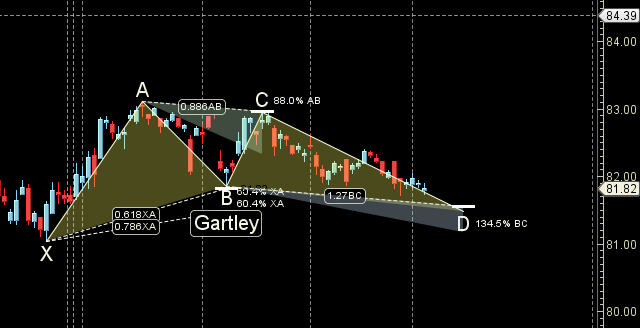
Price is heading towards 81.50/81 to complete GARTLEY pattern.