


Foreign Institutional Investors (FII) showed a Beaish approach in the Index Futures market by SELLING 10122 contracts worth 930 crores, resulting in a increase of 4954 contracts in the Net Open Interest. FII’s sold 2584 long contracts and added 7538 short contracts, indicating a preference for Shorting new positions. With a Net FII Long Short ratio of 0.18 FII used the market fall to exit long and enter short positions in Index Futures.
Are you Tradiing in Nifty or considering it as a trading opportunity? The monthly expiry in March 2023 is an important event to watch out for, as it can affect the prices of Nifty futures and options. In this post, we provide you with insights and analysis on what to expect from this expiry and how to prepare for it.
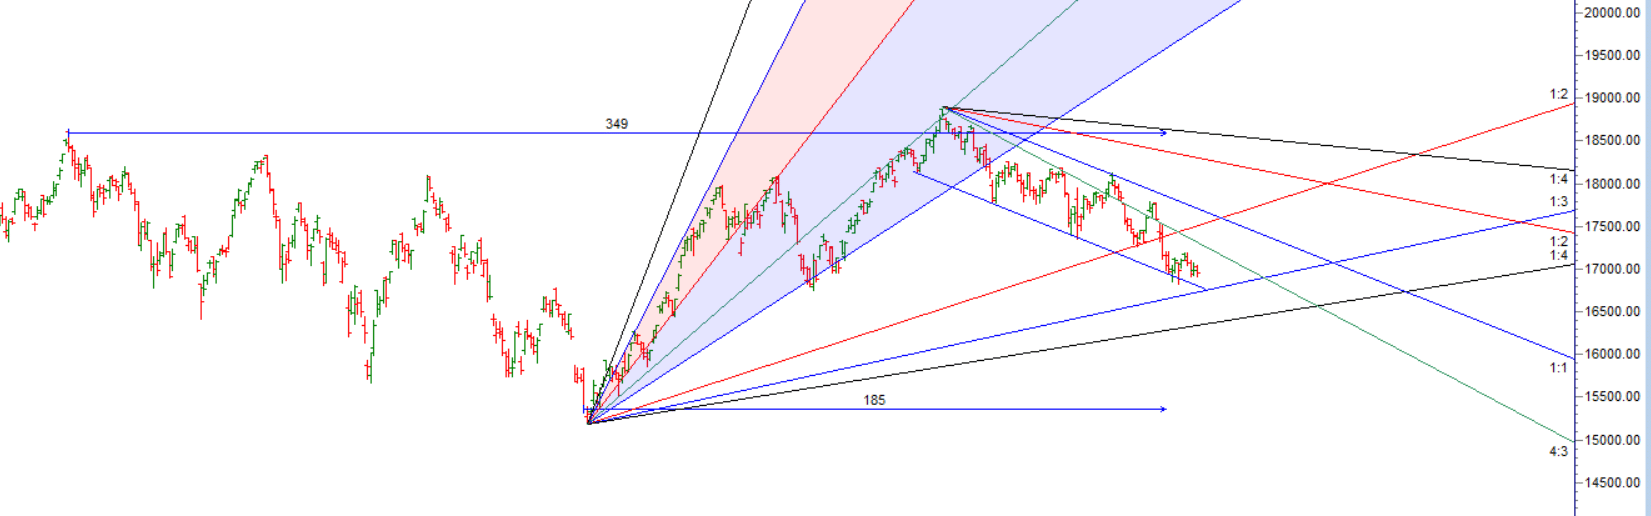
The Nifty Double Bottom Pattern is a popular technical analysis formation used by traders to identify potential trend reversals. A double bottom is a bullish reversal pattern that consists of two consecutive lows that are roughly equal, with a moderate peak in between. This formation signals that the market has reached a support level twice and is likely to bounce back up, creating a new uptrend.
Trading the Nifty Double Bottom Pattern involves some risks, such as false breakouts, slippage, or gap openings. To minimize these risks, you should use proper risk management techniques such as limiting your exposure to a certain percentage of your account, using a trailing stop loss, or scaling in and out of your positions.
Swing traders can expect a potential move towards 17087, 17152, 17217 if the market trades above 17022. However, if the market falls below 16900 , bears may become more active, leading to a move towards 16832,16746,16656

Traders may watch out for potential intraday reversals at 9:23,10:31,11:36,1:20, 2:07,2:56 How to Find and Trade Intraday Reversal Times
Nifty April Futures Open Interest Volume stood at 0.85 lakh, witnessing a addition of 26 lakh contracts. Additionally, the increase in Cost of Carry implies that there was a closeure of short positions today.
Nifty options chain shows that the maximum pain point is at 17000 and the put-call ratio (PCR) is at 0.95. Typically, when the PCR open interest ranges between 0.90 and 1.05, the market tends to remain range-bound. This suggests that Nifty may trade within a range of 16900-17200 levels in the near term
According to Yesterday data, retailers have sold 221285 call option contracts and 144450 shorted Call option contracts were covered . Additionally, they bought 24141 put option contracts and added 4241 shorted put option contracts, indicating a Neutral outlook.
In contrast, foreign institutional investors (FIIs) sold 73158 call option contracts and 60552 shorted call option contracts were covered . On the put side, FIIs sold 73158 put option contracts and shorted 37742 put option contracts, suggesting they have turned to a Neutral bias.
Nifty 50 Options Chain Analysis
The Nifty 50 options chain indicates that the highest open interest (OI) on the call side is at the 17,100 strike, followed by 17,200 strikes. On the put side, the highest OI is at the 17000 strike, followed by 16900 strikes. This suggests that the market participants are expecting Nifty 50 to remain range between 16900-17200 levels.
In the cash segment, Foreign Institutional Investors (FII) bought 1531 crores, while Domestic Institutional Investors (DII) sold 156 crores.
Traders who follow the musical octave trading path may find valuable insights in predicting Nifty’s movements. According to this path, Nifty may follow a path of 16825-17326-17826. This means that traders can take a position and potentially ride the move as Nifty moves through these levels.
Of course, it’s important to keep in mind that trading is inherently risky and market movements can be unpredictable. Low made was 16828 now heading towards 17326

I know it may sound strange to many readers, but there is an inverse relationship between analysis and trading results. More analysis or being able to make distinctions in the market’s behaviour will not produce better trading results– Mark Douglas
For Positional Traders, The Nifty Futures’ Trend Change Level is At 17334. Going Long Or Short Above Or Below This Level Can Help Them Stay On The Same Side As Institutions, With A Higher Risk-reward Ratio. Intraday Traders Can Keep An Eye On 16998 , Which Acts As An Intraday Trend Change Level.
Intraday Trading Levels
Buy Above 16987 Tgt 17026, 17066 and 17099 (Nifty Spot Levels)
Sell Below 16900 Tgt 16870, 16840 and 16800 (Nifty Spot Levels)
Upper End of Expiry : 17134
Lower End of Expiry : 16865