


Foreign Institutional Investors (FII) showed a Bearish approach in the Index Futures market by Selling 19762 contracts worth 1814 crores, resulting in a increase of 22570 contracts in the Net Open Interest. FII’s bought 1404 long contracts and added 21166 short contracts, indicating a preference for short selling on exisiting positions. With a Net FII Long Short ratio of 0.12 ,lowest in many months FII used the market rise to enter long and enter short positions in Index Futures.
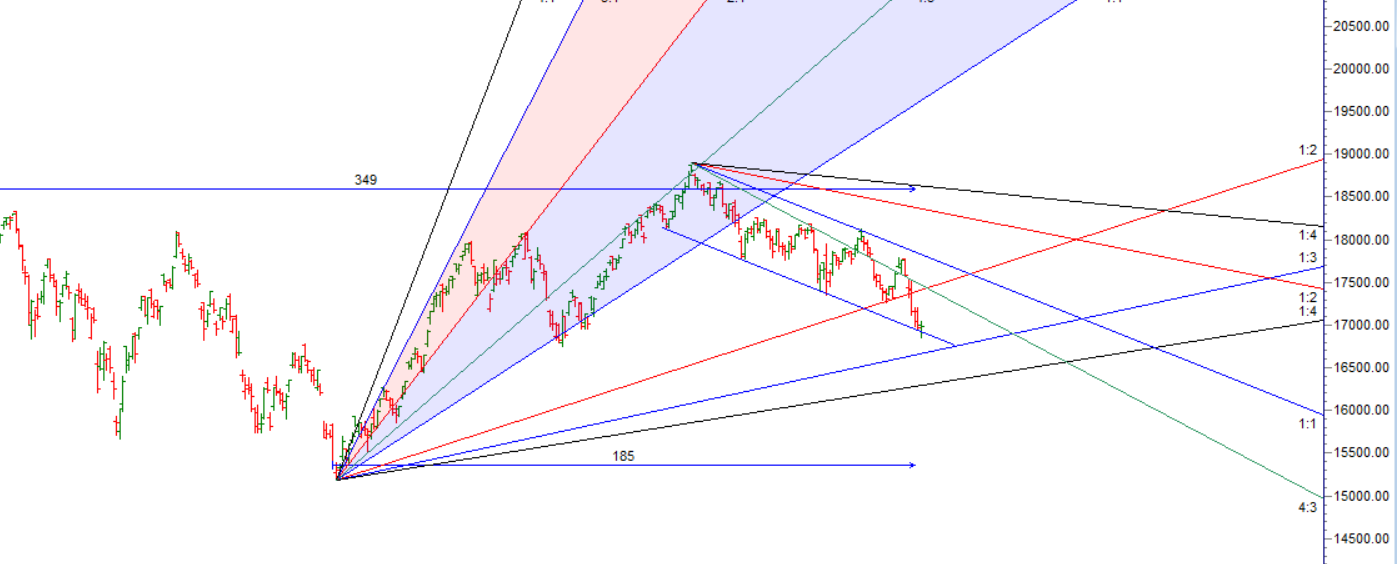
As Discussed In Last Analysis As for the Nifty index, it is currently near the Gann Angle , and if it can hold above the low of 17900 for at least an hour, it may provide some relief for bullish traders. However, in order for a short-term bottom to be formed and a rally to occur, the Nifty needs to close above 17025 on a daily basis.
It is important to note that the selling based on advance tax has ended and the NAV (net asset value) game will begin, so traders should exercise caution.
Furthermore, two important astrological events are happening today: Mercury Conjunct Neptune and Mercury Square Mars. For intraday traders, the high and low of the first 15 minutes of trading will be important indicators to guide their trading decisions.
Nifty closed above Gann angle and formed a doji on daily charts. Bulls need a close above 17050 to confirm a bottom. According to Bayer Rule 14, Venus movements in geocentric longitude using a unit of 1*9’13” can indicate market movements. Additionally, Bayer Rule 27 suggests that big tops and major bottoms occur when Mercury’s speed in geocentric longitude is 59 minutes or 1 degree 58 minutes. In an below video, we have explained how the Sun Conjunct Mercury aspect will lead to a good move in Nifty
Swing traders can expect a potential move towards 17157, 17274, or 17375 if the market trades above 17070. However, if the market falls below 16841 , bears may become more active, leading to a move towards 16754,16638

Traders may watch out for potential intraday reversals at 09:19,11:07, 12:11, 12:55, 2:43. How to Find and Trade Intraday Reversal Times
Nifty March Futures Open Interest Volume stood at 1.23 lakh, witnessing a liquidation of 0.88 lakh contracts. Additionally, the increase in Cost of Carry implies that there was a closeure of short positions today.
Nifty options chain shows that the maximum pain point is at 17000 and the put-call ratio (PCR) is at 0.67. Typically, when the PCR open interest ranges between 0.90 and 1.05, the market tends to remain range-bound. This suggests that Nifty may trade within a range of 16900-17200 levels in the near term
Nifty 50 Options Chain Analysis
The Nifty 50 options chain indicates that the highest open interest (OI) on the call side is at the 17,100 strike, followed by 17,200 strikes. On the put side, the highest OI is at the 16900 strike, followed by 16800 strikes. This suggests that the market participants are expecting Nifty 50 to remain range between 16900-17200 levels.
In the cash segment, Foreign Institutional Investors (FII) sold 282 crores, while Domestic Institutional Investors (DII) bought 2051 crores.
Traders who follow the musical octave trading path may find valuable insights in predicting Nifty’s movements. According to this path, Nifty may follow a path of 16825-17326-17826. This means that traders can take a position and potentially ride the move as Nifty moves through these levels.
Of course, it’s important to keep in mind that trading is inherently risky and market movements can be unpredictable.

“To be a successful trader, you have to be able to admit mistakes. People who are very bright don’t make very many mistakes. They don’t make very much money.” – William O’Neil
For Positional Traders, The Nifty Futures’ Trend Change Level is At 17471 . Going Long Or Short Above Or Below This Level Can Help Them Stay On The Same Side As Institutions, With A Higher Risk-reward Ratio. Intraday Traders Can Keep An Eye On 17029 , Which Acts As An Intraday Trend Change Level.