


Weekly Trends:
As of the week ending on March 4, 2023, the USD INR currency pair is trading at around 81.66. Over the past week, the pair has been in a downtrend, with the Indian Rupee strengthening against the US Dollar. The pair started the week at around 83 and reached a low of 81.71 on March 3, 2023. This decline in the USD INR pair can be attributed to the recent rally in the Indian and US stock market and US Bonds yielding falling.
Future Outlook:
Looking ahead, the USD INR currency pair is likely to continue to be influenced by various economic and political factors. Some of the key factors to watch out for include the US Federal Reserve’s monetary policy decisions, global economic conditions, and geopolitical tensions.
In the short term, the USD INR currency pair is expected to remain range-bound between 81.5 and 82.5 . However, if the Indian stock market continues to rally and the RBI remains accommodative, the Indian Rupee could strengthen further, pushing the USD INR pair towards the lower end of the range.
On the other hand, if there is a sudden surge in demand for the US Dollar due to global economic uncertainty or geopolitical tensions, the USD INR pair could break above the 82.5 level and head towards 83/83.25.
USD INR Gann Angle Chart
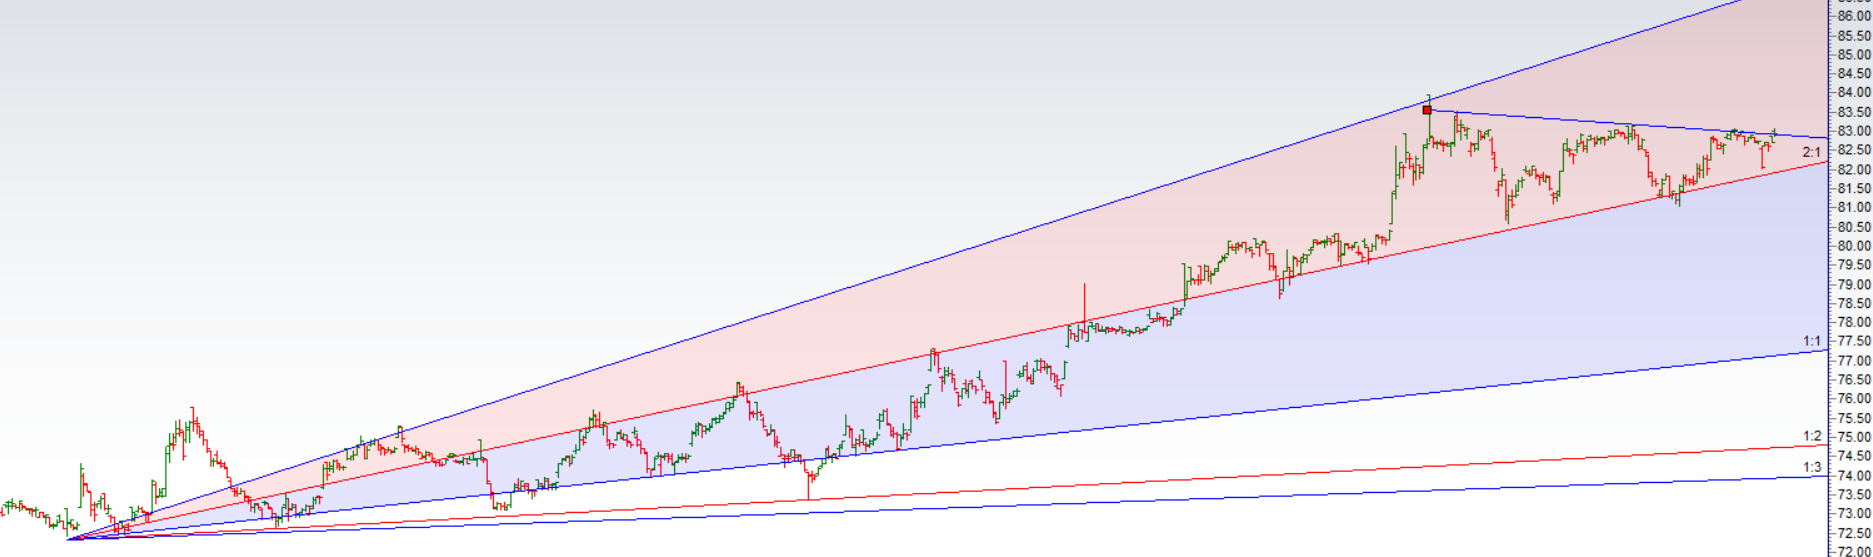
Price continue to get rejejcted from resistance of 83. USDINR saw a breakdown below 82.5 and did 82 on Friday, Any break of 82 can lead to fall towards 81.5/81.2.
USD INR Plannetary Support and Resistance Line

Indain Rupee is below Venus Plannetary line heading towards 81.25/81.50
USD INR Harmonic
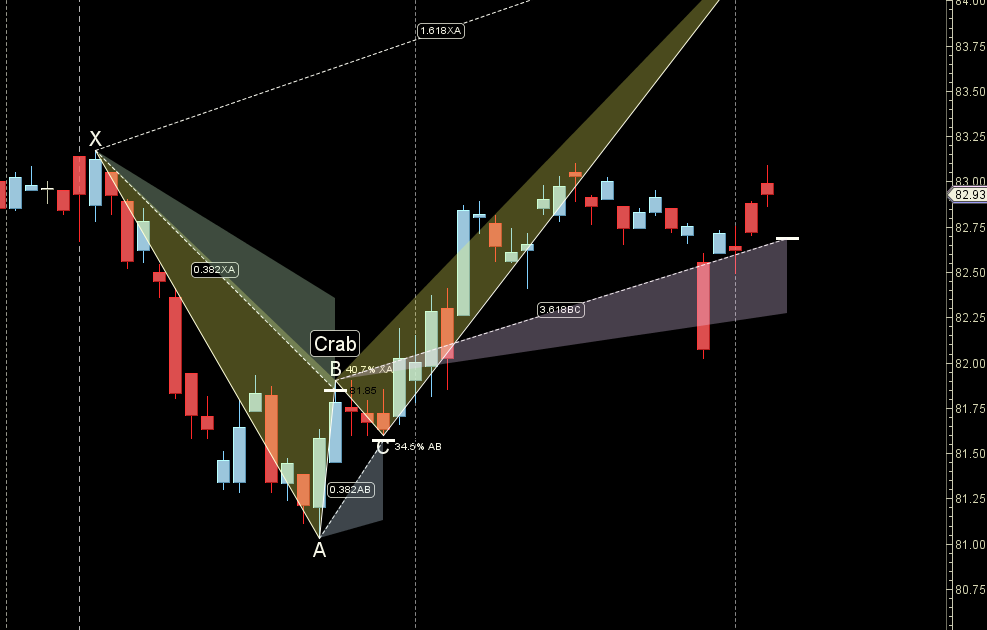
Price is heading towards 81.50 as SHARK pattern got completed.