


Gold is a popular precious metal that has been used as a store of value for centuries. As an investment asset, gold is considered a safe haven, particularly during times of economic uncertainty. In this article, we will provide a weekly technical analysis of gold, including the latest trends and future outlook.
Weekly Trends:
As of the week ending on March 4, 2023, gold was trading at around 55721 per Gram. Over the past week, gold prices have been in a downtrend, with prices increasing by approximately 0.5%. One of the key factors driving the decline in gold prices is the recent strength of the US dollar, which has been supported by rising Treasury yields and a strong economic recovery.
In addition, the ongoing concerns over inflation have also impacted gold prices, as investors are becoming increasingly confident that the Federal Reserve will raise interest rates sooner than expected to combat rising prices.
Future Outlook:
Looking ahead, the future outlook for gold will depend on various economic and geopolitical factors. Some of the key factors to watch out for include:
- US Federal Reserve Policy: Any changes in the US Federal Reserve’s monetary policy could have a significant impact on gold prices. If the Federal Reserve decides to raise interest rates in the future, it could lead to a decline in gold prices.
- Inflation Expectations: The expectations of inflation in the global economy are also an important factor for gold prices. If inflation continues to rise, gold prices could potentially increase as investors seek a safe haven asset.
- Geopolitical Tensions: Ongoing geopolitical tensions, such as the conflict between Russia and Ukraine, could also impact gold prices if they lead to a flight to safety among investors.
Based on the current trends and outlook, gold is likely to remain in a downtrend in the short term, with prices potentially reaching 54500-55000. However, traders should remain vigilant and keep an eye on the various economic and geopolitical factors that could influence the direction of gold prices in the coming weeks and months.
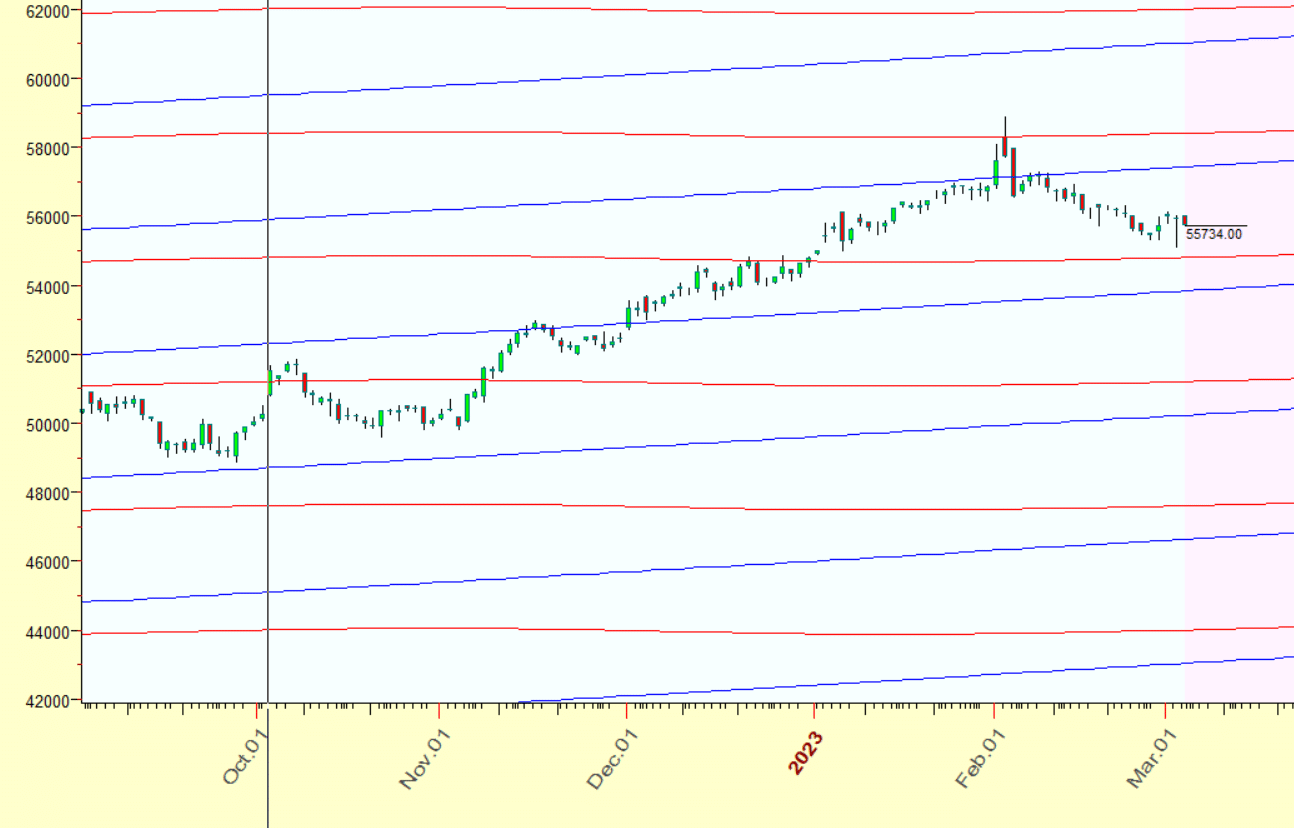
MCX GOLD Gann Angle Chart

MCX Gold has done its target of 1×1 line can see pullback towards 54500-55000.
MCX GOLD Astrology Support and Resistance Line
MCX Gold: Reacts from SUN Planetary Resistance Line.support in range of 55000-54500.
MCX GOLD Harmonic Analysis

Price is heading towards 54500-55000 as ABCD pattern is completed.