Considering 2021 as a whole, the NIFTY booked a 23% yearly gain, enjoying its best year since 2017. The index peaked at 18605 in October, driven by recovery from the pandemic-induced slump and strong retail participation in market debuts of companies like Paytm, Nykaa and Zomato.Most of Retail Investors Made money in 2021 as Small and Mid Caps came back in Limelight and many stocks up 3X to 10X from Jan Lows . Overall a Good Year for Investor and Traders who went with the trend.
Below is detailed analysis on Nifty based on various technical analysis techniques. Last Year Analysis
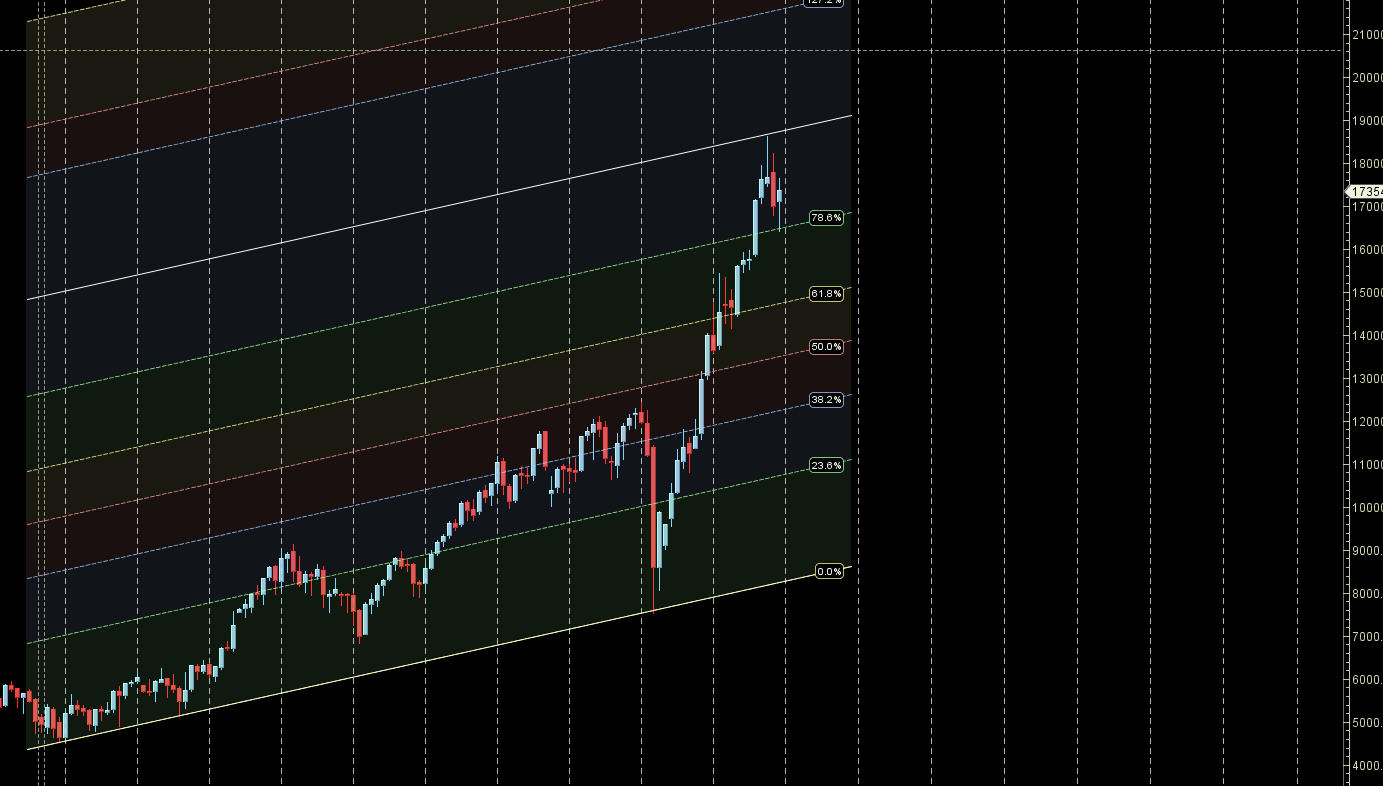
Yearly Chart

16410 is the at the bottom of regression channel holding the same rally can move towards 18605/19683. Below 16410 fall towards 15500.
Monthly Gann Chart

Monthly Chart with Gann Angles is shown shows wide range for coming years 17576 above 19683 and below 16410 fall towards 15625
Elliot Wave Analysis

Self Explantory Chart
Harmonic Analysis

18380/18867 is target of harmonic patter till we are holding 16410
Nifty Projected Price and Time Pattern based on Neural Forecast
Below is Neural Forecast for 2022, It is not a FOOLPROOF Technique and its works 60-65% of time. So Please do not take aggresive trade without SL.

Important Pressure Dates as per Gann and Astro Analysis :
Below dates based on Astro and Gann Techniques can see Trend Change in Market.
04-Jan-22
23-Jan-22
30-Jan-22
15-Feb-22
02-Mar-22
28-Mar-22
14-Apr-22
06-May-22
21-May-22
10-Jun-22
21-Jun-22
02-Jul-22
18-Jul-22
12-Aug-22
19-Aug-22
16-Sep-22
26-Sep-22
22-Oct-22
08-Nov-22
19-Nov-22
23-Dec-22
29-Dec-22
