


Overview
The Money Flow Index (“MFI”) is a momentum indicator that measures the strength of
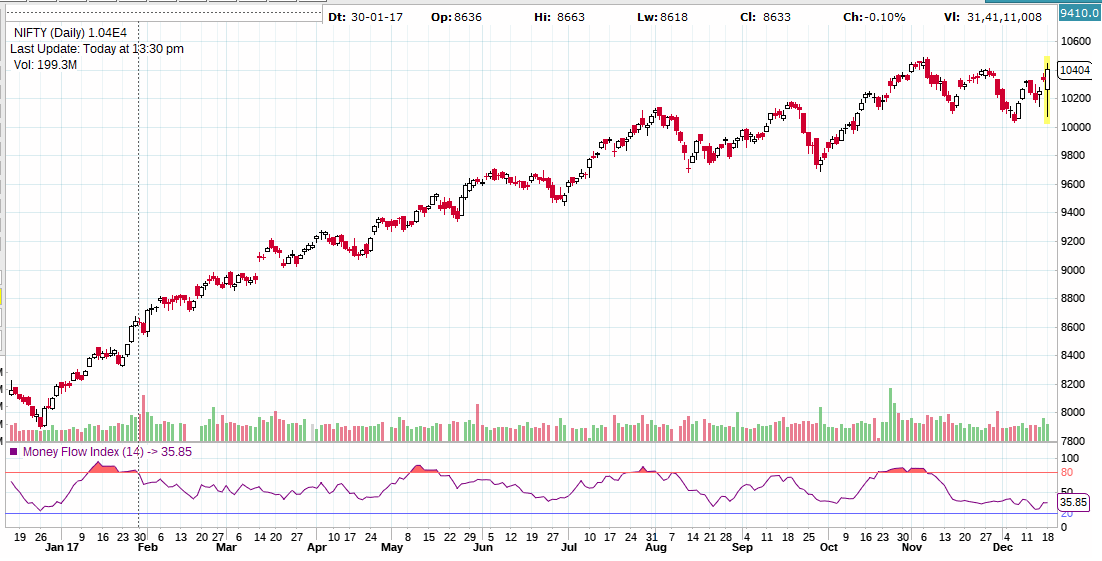
money flowing in and out of a security. It uses both price and volume to measure buying and selling pressure. Created by Gene Quong and Avrum Soudack, It is related to the Relative Strength Index, but where the RSI only incorporates prices, the Money Flow Index accounts for volume. MFI starts with the typical price for each period. Money flow is positive when the typical price rises (buying pressure) and negative when the typical price declines (selling pressure). A ratio of positive and negative money flow is then plugged into an RSI formula to create an oscillator that moves between zero and one hundred. As a momentum oscillator tied to volume, the Money Flow Index (MFI) is best suited to identify reversals and price extremes with a variety of signals. Below we have shown an NIFTY chart with Money Flow Index.
Calculation
The Money Flow Index requires a series of calculations as discussed below
First, the period’s Typical Price is calculated.
Typical Price = (High + Low + Close)/3
Next, Raw Money Flow (not the Money Flow Index) is calculated by multiplying the periods
Typical Price by the volume.
Raw Money Flow = Typical Price x Volume
If today’s Typical Price is greater than yesterday’s Typical Price, it is considered Positive
Money Flow. Positive Money Flow is the sum of the Positive Money over the specified number of periods.
If today’s price is less, it is considered Negative Money Flow.Negative Money Flow is the sum of the Negative Money over the specified number of periods.
The Money Ratio is then calculated by dividing the Positive Money Flow by the Negative
Money Flow over a specified period of time, Generally 14 is used as a default period.
Money Flow Ratio = (14-period Positive Money Flow)/(14-period Negative Money Flow)
Finally, the Money Flow Index is calculated using the Money Ratio
Money Flow Index = 100 – 100/(1 + Money Flow Ratio)
Interpretation
The MFI’s calculation generates a value that is then plotted as a line that moves within a range of 0-100, making it an oscillator. When the MFI rises, this indicates an increase in buying pressure. When it falls, this indicates an increase in selling pressure. The Money Flow Index can generate several signals, most notably; overbought and oversold conditions and divergences (Positive/Negative)
he interpretation of the Money Flow Index is as follows:
- Look for market tops to occur when the Money Flow Index (MFI) is above 90. Look for market bottoms to occur when the MFI is below 10.
- Look for divergence between the indicator and the price action. If the price trends higher and the Money Flow Index (MFI) trends lower (or vice versa), a reversal may be imminent.
Lets discuss both these scenarios with appropriate examples in the next post.