


In Continuation with Previous Post
Overbought/Oversold
Overbought and oversold levels can be used to identify unsustainable price extremes.
- Money Flow Index (MFI) above 90 is considered overbought.
- Money Flow Index (MFI) below 10 is considered oversold.
As the saying goes Overbought market can remain overbought for extended period of time.
Strong trends can present a problem for these classic overbought and oversold levels. MFI can become overbought (>80) and prices can simply continue higher when the uptrend is strong. Conversely, MFI can become oversold (<20) and prices can simply continue lower when the downtrend is strong. Quong and Soudack recommended expanding these extremes to further qualify signals. A move above 90 is truly overbought and a move below 10 is truly oversold. Moves above 90 and below 10 are rare occurrences that suggest a price move is unsustainable.
Lets understand the Overbought scenario with Example of IBM
IBM has been in a strong uptrend from 11 Feb 2016 where it made low of 116.90 and have been rallying and made a high of 153.50 on 04 April 2016.
As shown in below chart 01 April Money Flow Index (MFI) touched 91.7 as we have discussed the Money Flow Index (MFI) above 90 is not sustainable and if we get a confirmation from a reversal candlestick it makes a case for short selling.
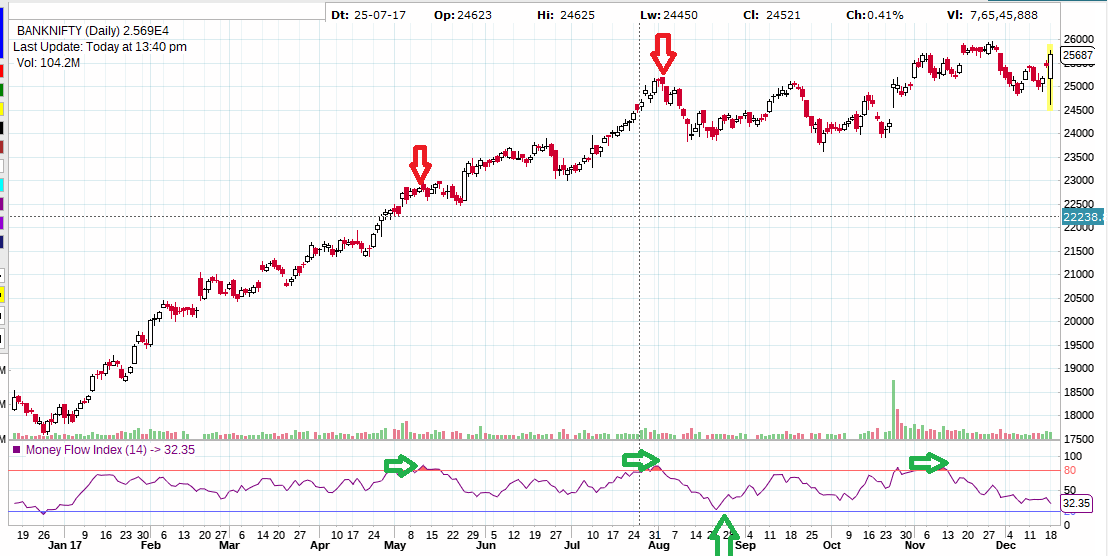
As seen in above chart of Bank Nifty whenever MFI went above 90 and its start breaking 90 from upside we got a good fall.
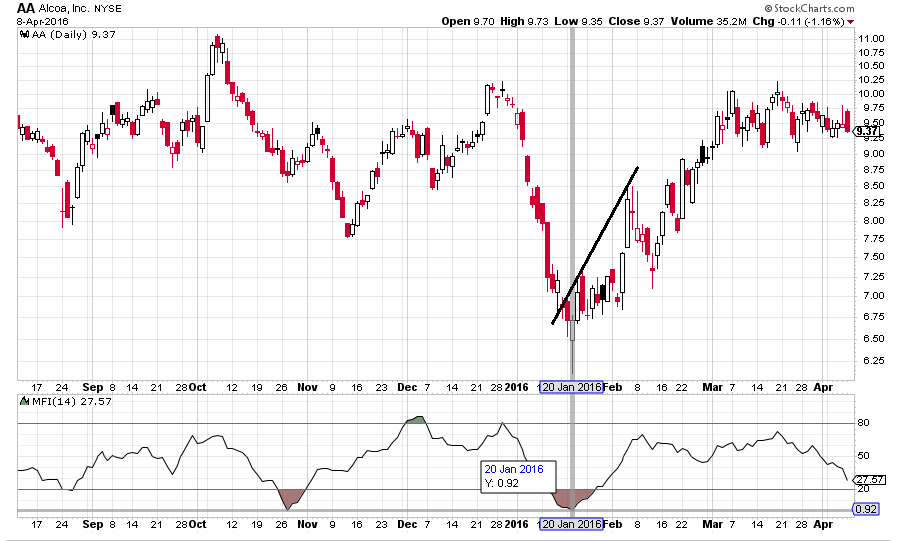
Lets understand the Oversold scenario with Example of Alcoa Inc (AA)
AA has been in a strong downtrend from 29th Dec 2015 where it made High of $10.23 and have been falling and made a low of $6.11 on 20th Jan 2016.
As shown in below chart 20th Jan 2016 Money Flow Index (MFI) touched 0.92 as we have discussed the Money Flow Index (MFI) below 10 is not sustainable and if we get a confirmation from a reversal candlestick it makes a case for going Long in Aloca Inc.
AA on 20th Jan made a Hammer candlestick which is a reversal pattern, Longs can be taken around $6.6 with SL of $6 for 5-6% down move or till MFI does not reach 50 where part booking can be done and remaining position can be carried forward with perope Trailing Stop Loss. Aloca Inc made High of 8.45 on 04th Feb 2016 when Money Flow Index (MFI) touched 50.
Divergences
MFI Divergence occurs when there is a difference between what the price action is indicating and what MFI is indicating. These differences can be interpreted as an impending reversal. There are two types of divergences, bearish and bullish.
- Bullish MFI Divergence
A bullish Divergence occurs when MFI becomes oversold below 20, surges above 20, holds above 20 on a pullback and then breaks above its prior reaction high. A bullish divergence forms when prices move to a lower low, but the indicator forms a higher low to show improving money flow or momentum.
- Bearish MFI Divergence – When price makes a new high but MFI makes a lower high.
Lets discuss both these scenarios with appropriate examples.
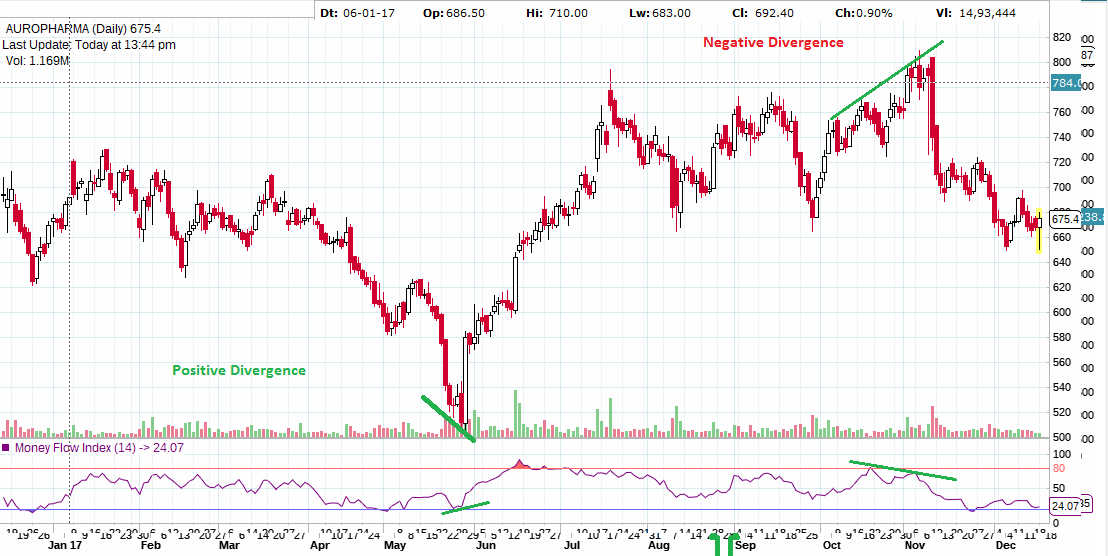
On the Aurobindo Pharma below, a bullish divergence can be seen when Price was making Lower Lows in June 17 month but MFI was making Higher Highs as shown below. As shown below Divergence did show the effect and From low of 544 till 760 till MFI became overbought touching 80 range. Bearish Divergence also shown in below chart.
Conclusion
The Money Flow Index is a rather unique indicator that combines momentum and volume with an RSI formula. MFI is better suited to identify potential reversals with overbought/oversold levels, bullish/bearish divergences.As with all indicators, MFI should not be used by itself. A pure momentum oscillator, such as RSI, or pattern analysis can be combined with MFI to increase signal robustness.