


Godrej Industries
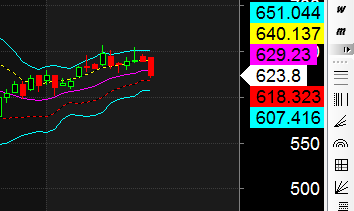
Positional Traders can use the below mentioned levels
Close below 620 Target 610/597
Intraday Traders can use the below mentioned levels
Buy above 625 Tgt 629, 637 and 645 SL 621
Sell below 620 Tgt 614,607 and 600 SL 624
Tata Chemical
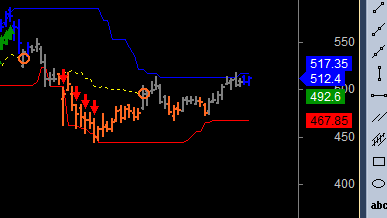
Positional Traders can use the below mentioned levels
Close below 640 Target 623/610
Intraday Traders can use the below mentioned levels
Buy above 650 Tgt 656, 662 and 670 SL 646
Sell below 644 Tgt 638,632 and 622 SL 648
NIIT Tech
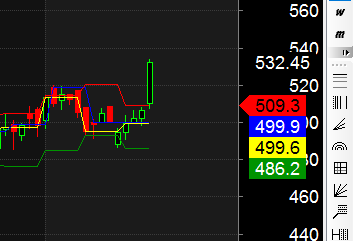
Positional Traders can use the below mentioned levels
Close above 535 Target 555/576
Intraday Traders can use the below mentioned levels
Buy above 535 Tgt 542, 547 and 555 SL 530
Sell below 528 Tgt 524,519 and 514 SL 532
How to trade Intraday and Positional Stocks Analysis — Click on this link
Performance sheet for Intraday and Positional is updated for August Month, Intraday Profit of 5.67 Lakh and Positional Profit of 5.64 Lakh. Please note we do not have any “ADVISORY Service”, I share this sheet to see how the system are performing and money can be made in Stock Market if System are followed with discipline. Also the performance differs from trader to trader.
http://tradingsystemperformance.blogspot.in/
http://stockpositionaltrading.blogspot.in/
- All prices relate to the NSE Spot/Cash Market
- Calls are based on the previous trading day’s price activity.
- Intraday call is valid for the next trading session only unless otherwise mentioned.
- Stop-loss levels are given so that there is a level below/above, which the market will tell us that the call has gone wrong. Stop-loss is an essential risk control mechanism; it should always be there.
- Book, at least, part profits when the prices reach their targets; if you continue to hold on to positions then use trailing stops to lock in your profits.
Follow on Facebook during Market Hours: https://www.facebook.com/pages/Bramesh
Follow on Twitter during Market Hours: https://twitter.com/brahmesh