


Sun Pharma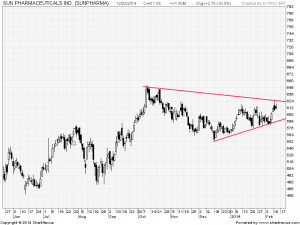

Buy above 613.8 Tgt 617,622 and 626 SL 611
Sell below 610 TGt 607.5,604 and 597 SL 612
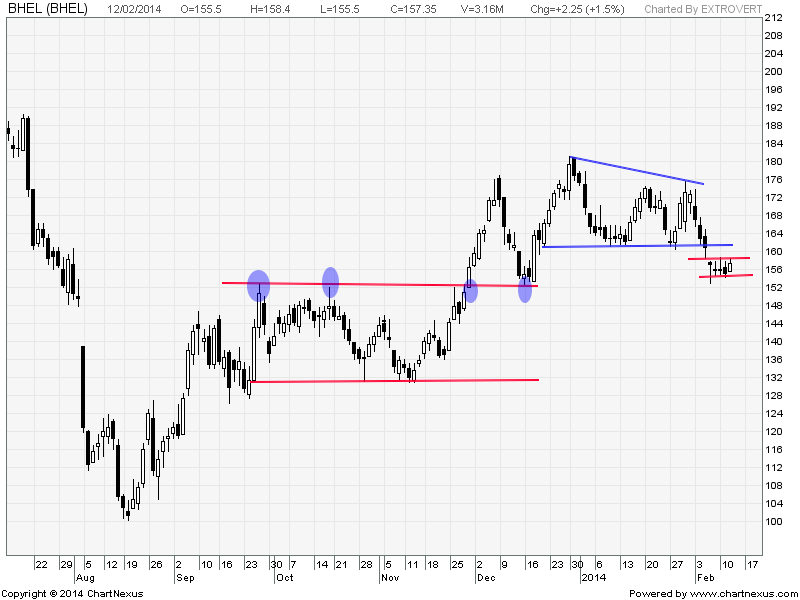
BHEL
Buy above 157.5 Tgt 158.6,159.9 and 161.5 SL 157
Sell below 155.5 Tgt 154.1,152.8 and 150 SL 157
BIOCON
Buy above 434 TGt 437,441 and 444 SL 432
Sell below 429.5 Tgt 427,422 and 417 SL 432

Performance sheet for Intraday and Positional is updated for February
http://tradingsystemperformance.blogspot.in/
http://positionalcallsperformance.blogspot.in/
- All prices relate to the NSE Spot
- Calls are based on the previous trading day’s price activity.
- The call is valid for the next trading session only unless otherwise mentioned.
- Stop-loss levels are given so that there is a level below/above, which the market will tell us that the call has gone wrong. Stop-loss is an essential risk control mechanism; it should always be there.
- Book, at least, part profits when the prices reach their targets; if you continue to hold on to positions then use trailing stops to lock in your profits.