


PFC
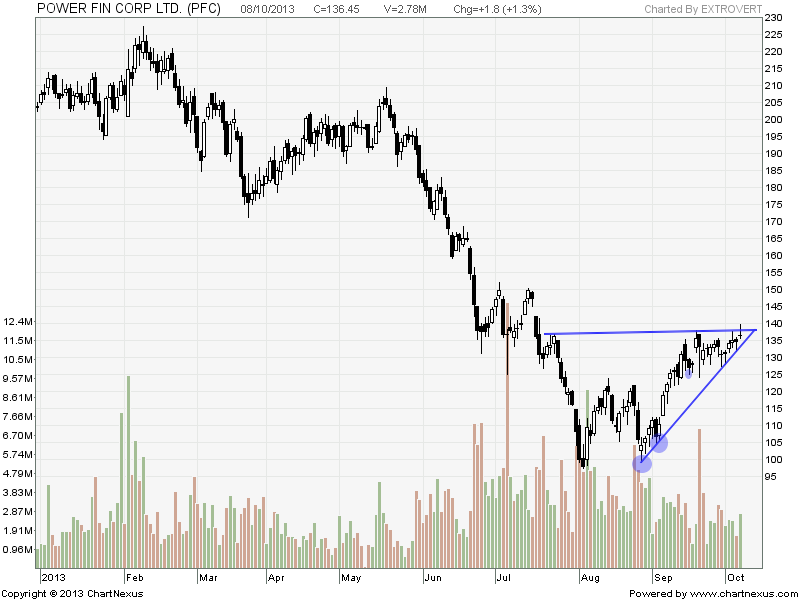 Trading is an ascending traingle with formation of gravestone soji pattern singalling explosive move ahead.
Buy above 137.3 Tgt 139,141 and 143 SL 136.4
Sell below 135.5 Tgt 134.5,133 and131 SL 137
PNB
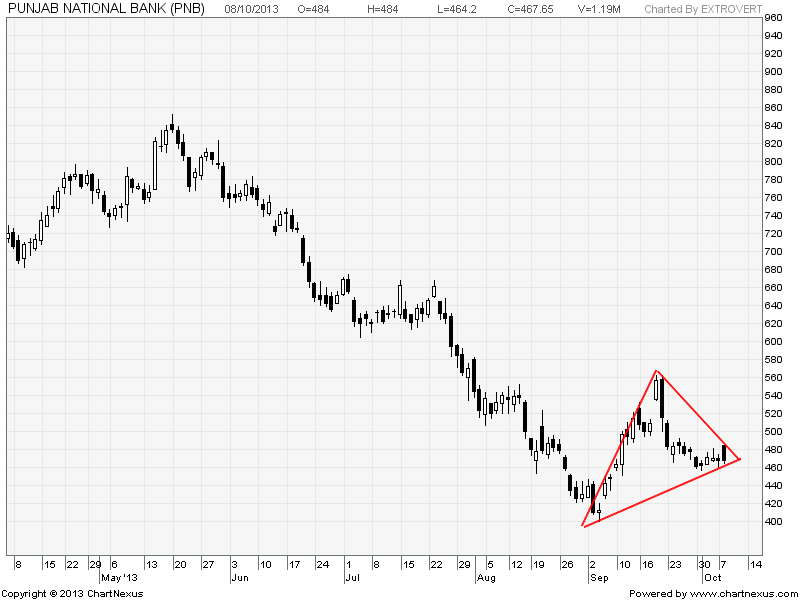 PNB formed a triangle pattern Closing below 460 gives short term target of 432.
Buy above 472 Tgt 477,484 and 490 SL 467
Sell below 466 Tgt 460,453 and 448 SL 470
Ranbaxy
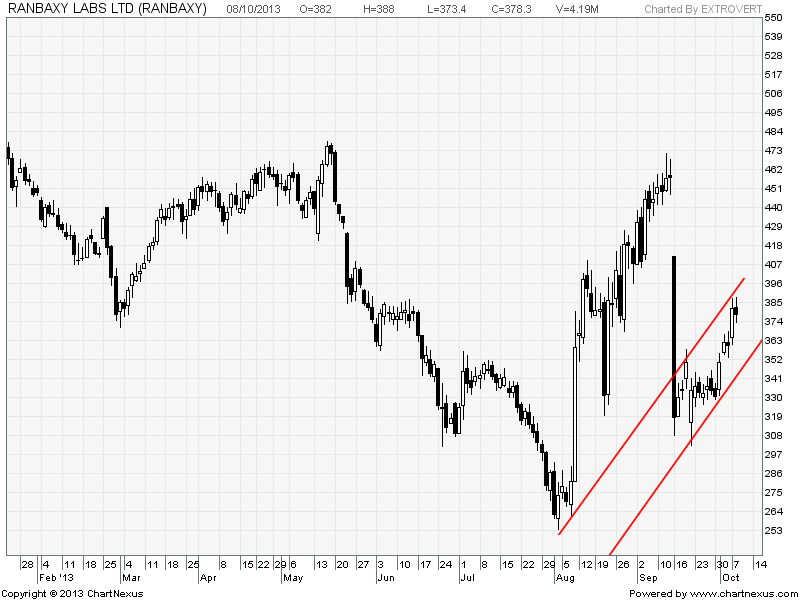 Double top formation.
Buy above 380 Tgt 384,388 and 394 SL 378
Sell below 377 Tgt 373,369 and 364 SL 378
Stock Performance Sheet for the Month of September is Updated @http://tradingsystemperformance.blogspot.in/ Net Profit for the month of Sep is 1.82 Lakh and Oct Month 66.6 K
Stock Performance Positional sheet for Sep Month is updated on http://positionalcallsperformance.blogspot.com/ Net Profit for Sep Month 2.35 Lakhs
- All prices relate to the NSE Spot
- Calls are based on the previous trading day’s price activity.
- The call is valid for the next trading session only unless otherwise mentioned.
- Stop-loss levels are given so that there is a level below/above, which the market will tell us that the call has gone wrong. Stop-loss is an essential risk control mechanism; it should always be there.
- Book, at least, part profits when the prices reach their targets; if you continue to hold on to positions then use trailing stops to lock in your profits.
Thanks Bramesh,
So PFC was in no trade zone today…so can i enter in pfc tomorrow if trade triggers?
level is valid for next day ??????
yess
Hi bramesh,
As you mentioned that pnb close below 460…target 432..so it will be valid in coming days also…if any day pnb closes below 460 will it be short?
Yes Sir !!