


In Our last analysis, Indian Rupee heading for 61-62 levels,Weekly Analysis Rupee made low of 61.5 and bounced back. Now lets analyze rupee movement for coming week.
USD INR Hourly
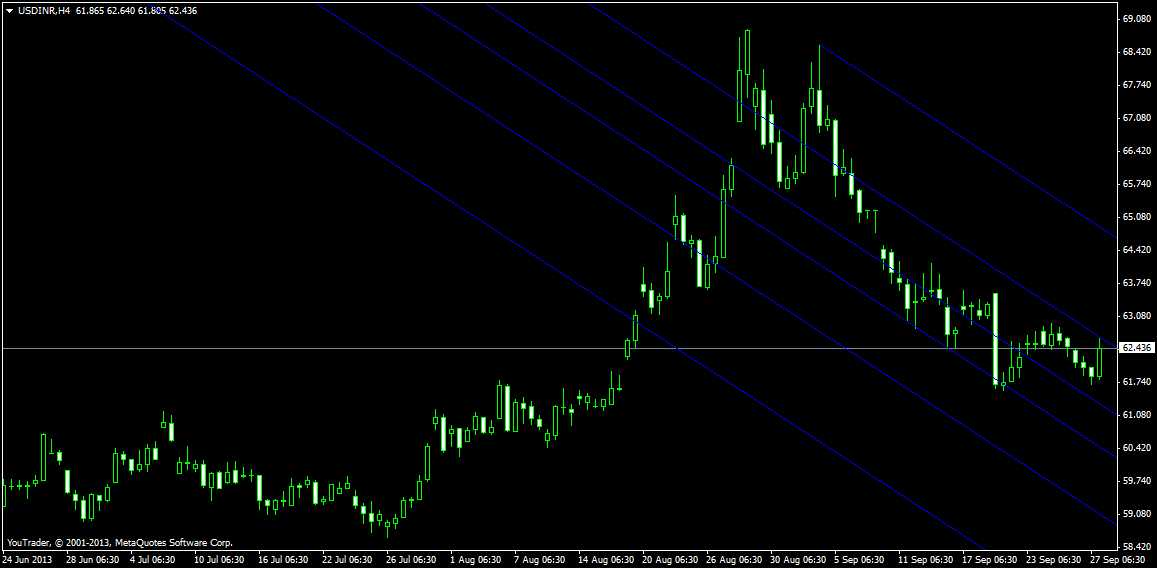
USD INR Hourly charts from MT4 platform are getting resisted at top of the Fibo channel any move above it can see rupee moving back to 64 odd levels.
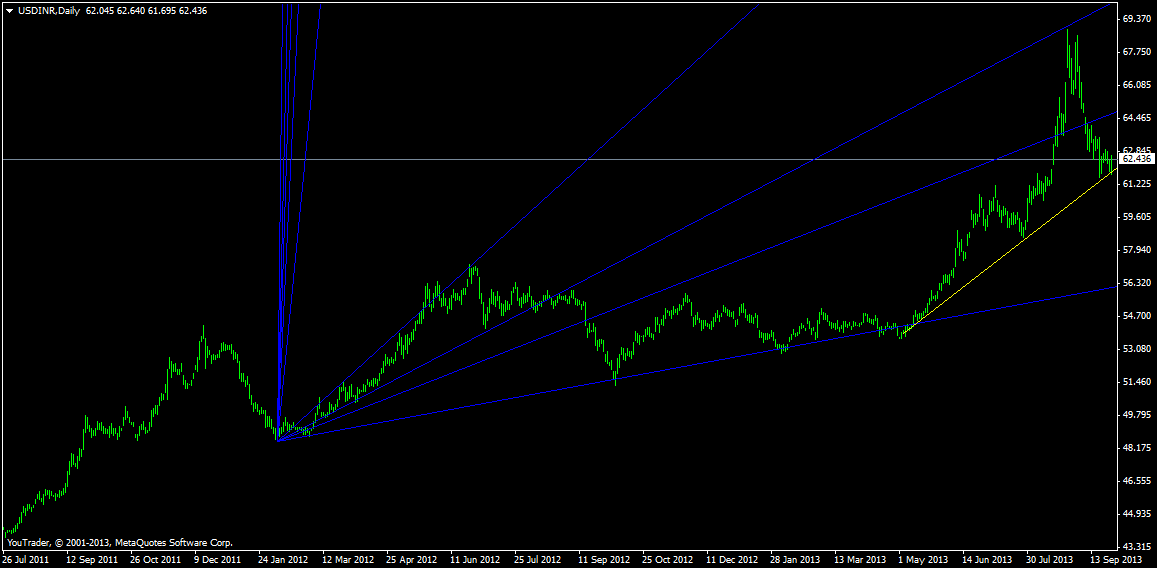
USD INR Daily

USD INR chart taken from MT4 platform made top as per Gann Fan as discussed in previous post. Now if INR holds its trendline support it will bounceback back to 64 odd levels.
USD INR Weekly
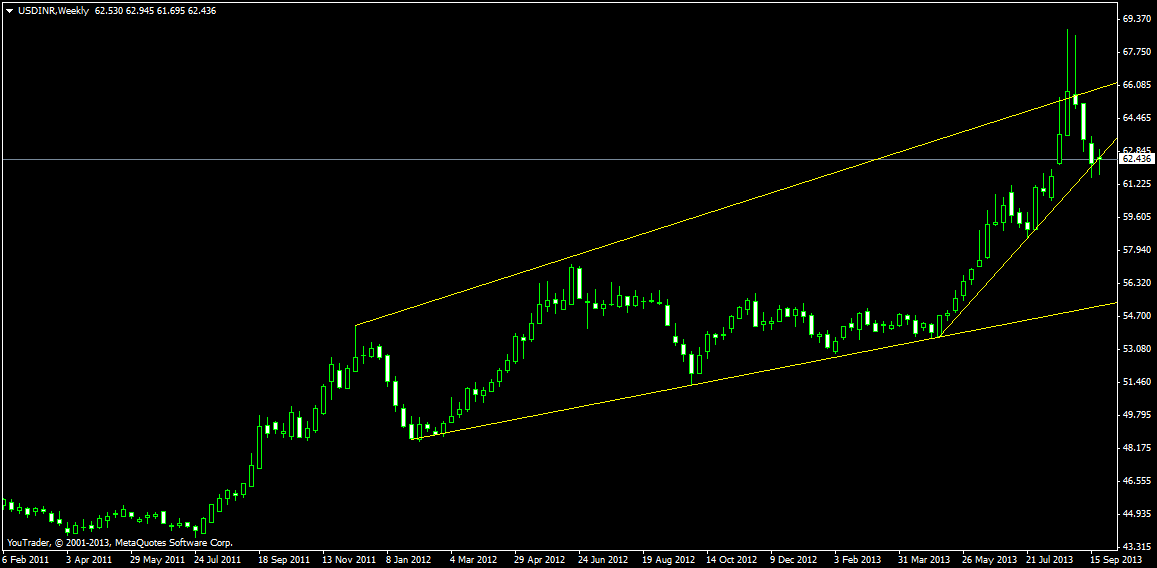
Weekly charts tried moving above the weekly trendline but failed to do for 2 weeks in row.Weekly charts are also near the trendline support.
USD – INR Trend Deciding Level:62.95
USD – INR Resistance:63.8,64.2 and 65.2
USD – INR Support:62.3,61.5 and 61
Levels mentioned are USD – INR September Future
Follow on Facebook during Market Hours: http://www.facebook.com/pages/Brameshs-Tech/140117182685863