


DLF
 DLF stock is forming a falling wedge pattern on daily chart which is bullish sign, after falling like 9 pins DLF has formed an DOJI, which as per technical analysis is signalls pause in downtrend. Holding 124 from next 3 days stock can bounce back to 144 odd levels in short term.
Buy above 132 Tgt 136,139 and 142 SL 129
Sell below 128 Tgt 125,121 and 117 SL 130
Tata Power
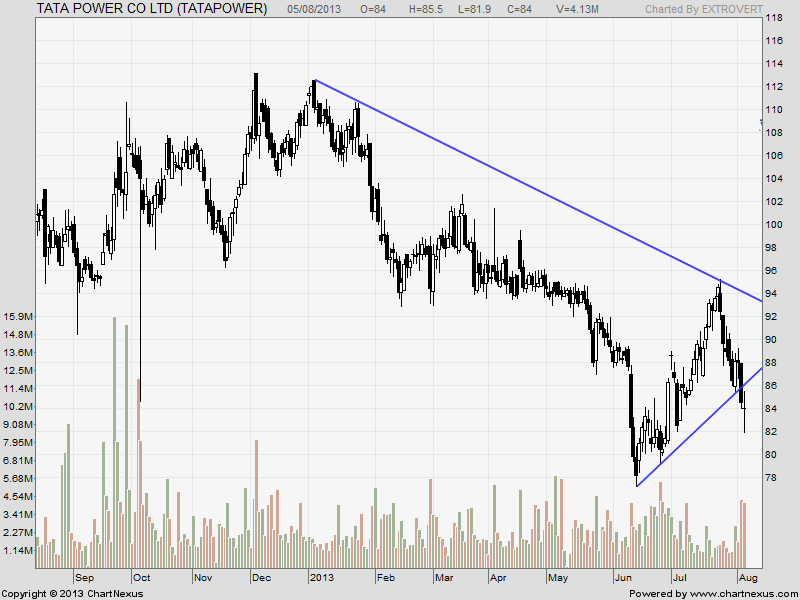
Tata power stock as per daily chart has given a triangle breakout, After giving a triangle breakout stock has formed an DOJI candelstick pattern which again as per classic technical analysis suggests a pause and breakdown can be whipsaw if stock us able to close above 89. Breakdown gets confirmed below 81 and short term target comes at 76 and 68. This is High risk trade so trade cautiously or avoid if you are conservative trader.
Buy above 85.8 Tgt 87.4,89.3 and 91 SL 83.5
Sell below 83 Tgt 82,80 and 78.5 SL 84
Bata India
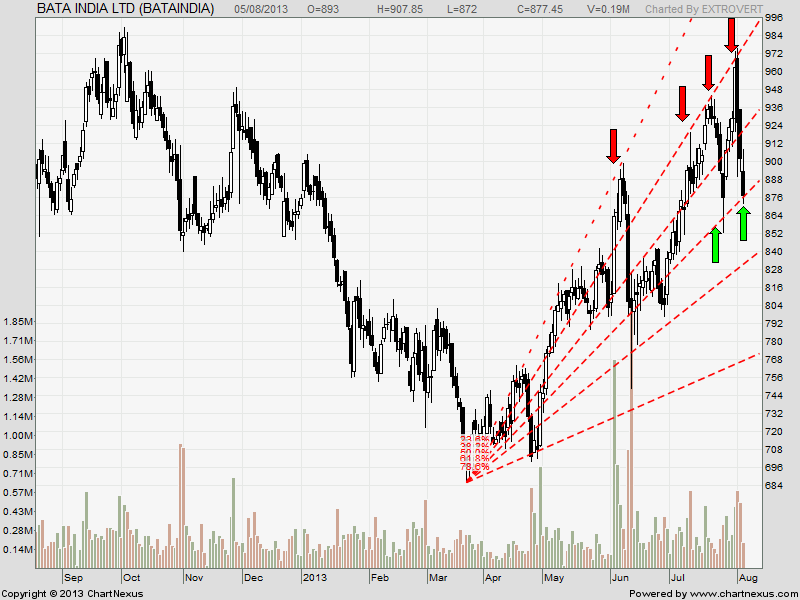
Bata India stock respects its Fibo fans as shown is above daily chart. If stock breaks 877 as per fibo fans short term target comes to 843.Any close above 898 gives target as 932.
Buy above 886 Tgt 899,907 and 920 SL 877
Sell below 872 Tgt 863,850 and 843 SL 880
Stock Performance Sheet for the Month of June is Updated @http://tradingsystemperformance.blogspot.in/ Net Profit for the month of Aug is 80.5 K
- All prices relate to the NSE Spot
- Calls are based on the previous trading day’s price activity.
- The call is valid for the next trading session only unless otherwise mentioned.
- Stop-loss levels are given so that there is a level below/above, which the market will tell us that the call has gone wrong. Stop-loss is an essential risk control mechanism; it should always be there.
- Book, at least, part profits when the prices reach their targets; if you continue to hold on to positions then use trailing stops to lock in your profits.
We do discussion in Live market to update Nifty/Stock levels If you are interested you can LIKE the page to get Real Time Updates.