


- FIIs sold 5261 contracts of Index Future (22560 Contracts were sold and 17299 fresh shorts were entered into system) worth 1132 cores with net Open Interest decreasing by 5261 contracts. So as per data analysis, FII are exiting longs and entering fresh shorts in market. Golden Rules for Traders trading based on Chart/ Chart Pattern
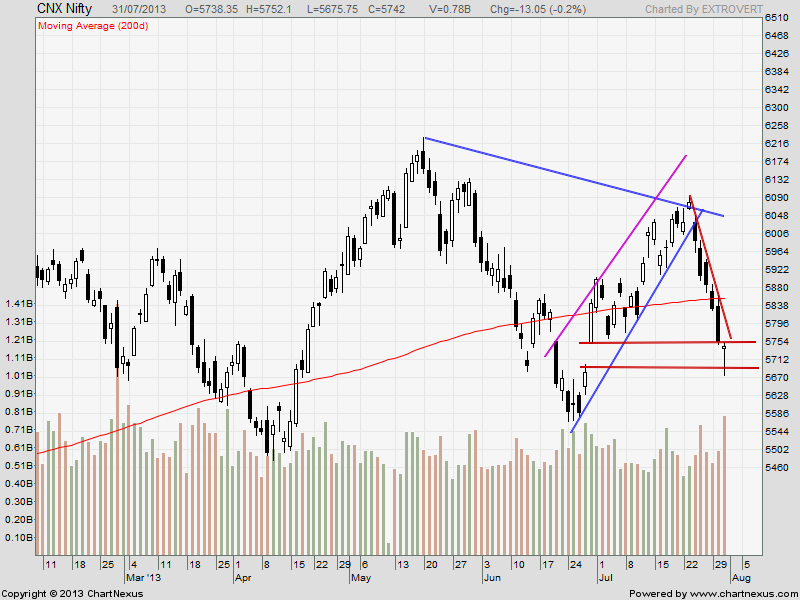
- Nifty continued with its downtrend, falling for 6 consecutive day,Nifty has formed an Hammer candlestick pattern today, which suggests pause in down move and reversal of trend, we need to see follow up move above 5800 for the same. Also the premium in Nifty future is quiet high so any rally will get sold into. As discussed in Weekly analysis Nifty Spot till it trades below 5900 bears will be in power and today we completed all the weekly targets :).
- Nifty Future Aug Open Interest Volume is at 1.67 cores with liquidation of 6.5 lakhs in Open Interest, shorts booking profit with fall in Cost of Carry.
- Total Future & Option trading volume at 1.30 lakh with total contract traded at 2.8 lakh , PCR (Put to Call Ratio) at 0.87.
- 6000 Nifty CE is having highest OI at 59.1 lakhs with addition of 4.2 lakhs in OI, is wall of resistance. 5900 CE liquidated 6.3 lakh in OI and having second highest OI at 36 lakh, smart money exited out of 5900 CE,5800 CE adding 3.1 lakh in OI suggests bears are confident of holding below 5800. 5600-6200 CE added 8.5 lakh in OI.
- 5700 PE OI at 59.3 lakh remain the highest OI, with addition of 6.4 lakh in OI, today bulls were able to protect 5700 on closing basis so 5700 PE writers were able to hold on today, 5600 PE added 6.4 lakh in OI and smart money has bought put as per OI analysis, so will be continue the down move ? 5600-6200 PE liquidated 5.2 lakh in OI.

- FIIs bought in Equity in tune of 142 cores ,and DII sold 128 cores in cash segment ,INR closed at 61.05
- Nifty Futures Trend Deciding level is 5680 (For Intraday Traders).Nifty Trend Changer Level 5882 and Bank Nifty Trend Changer level 10462.
Buy above 5752 Tgt 5771,5800 and 5833(Nifty Spot Levels)
Sell below 5720 Tgt 5700,5675 and 5650(Nifty Spot Levels)
Live Nifty A/D charts Click on the Link
Traders who use Pivot and Camarilla can use the following 2 sites for Hourly values and EOD values
http://camarillapivotpoints.blogspot.com/
http://niftystockpivot.blogspot.in/
We do discussion in Live market to update Nifty levels If you are interested you can LIKE the page to get Real Time Updates.
Follow on Facebook during Market Hours: http://www.facebook.com/pages/Brameshs-Tech/140117182685863
Sir,
I am a beginner. I found your blogs very useful.
I have few questions.
In the SEBI site http://www.sebi.gov.in/sebiweb/investment/FIILatestSE.jsp?period=day
FII data is defferent from what is mentioned in your blog. Which one is correct and from where you get this details.
I see in channels analysis mentioning that specific number of call or put option brought by FII. But I see in the SEBI site it only mentioned the option contract brought by FII and there is no classification as call or put option. How do they get this details.
Also how to we get the FII activites on other index (Eg. BankNifty) and other stocks.
Thanks in advance
regards
Raghav
Dear Raghav,
You need to take data from Nse Site not from SEBI site.
Rgds,
Bramesh