


As expected last week, Indian market gained on sharp decline in commodity prices, esp. that of crude oil, which fell less than $100 a barrel (Brent). Higher than expected decline in inflation for the month of March, 2013 to 5.96 percent also aided higher rate cut expectations in the market, which led to sharp rally in rate sensitive stocks, esp. Banking, as per our Trend Changer level we were able to capture 800 points in Bank Nifty and 200 Points in Nifty Futures.
Last week we gave Trend Deciding level as 5545 achieved all weekly targets on upside.
Nifty 4 Hourly Chart

Nifty 4 Hourly charts has broken the Fibo Regression Channels on upside and next level of resistance comes at 5872
Nifty Gaps
For Nifty traders who follow gap trading there are 1 trade gaps in the range of 5400-6000 and all other gaps got filled.
- 5872-5863
- 5477-5446
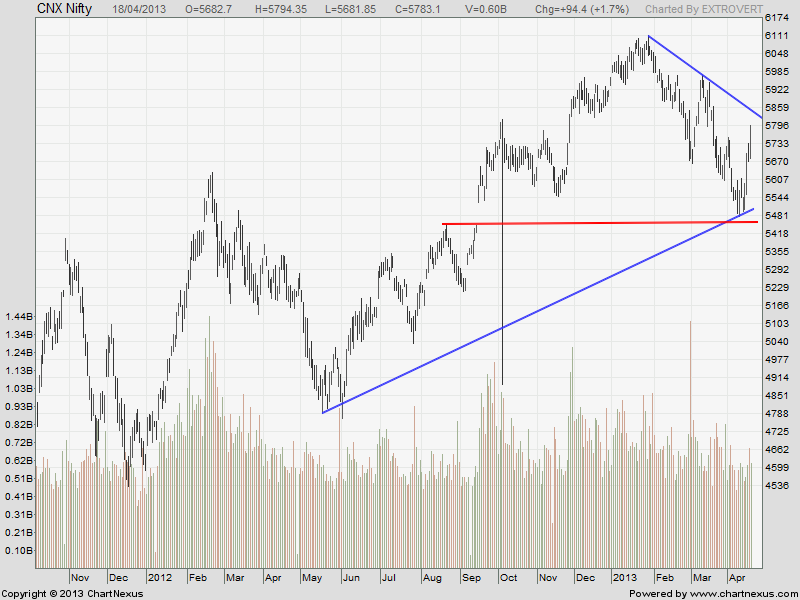
Nifty Daily Chart
As per last week analysis we clearly indicated the demand zone of red and blue line crossover, Nifty gave the expected bounceback and also crossed and closed above its 50 DMA, which it was unable to cross previously for next 5 attempts. Falling trendline resistance comes at 5830 which could lead to profit booking and pullback in nifty.
Fibonacci technique
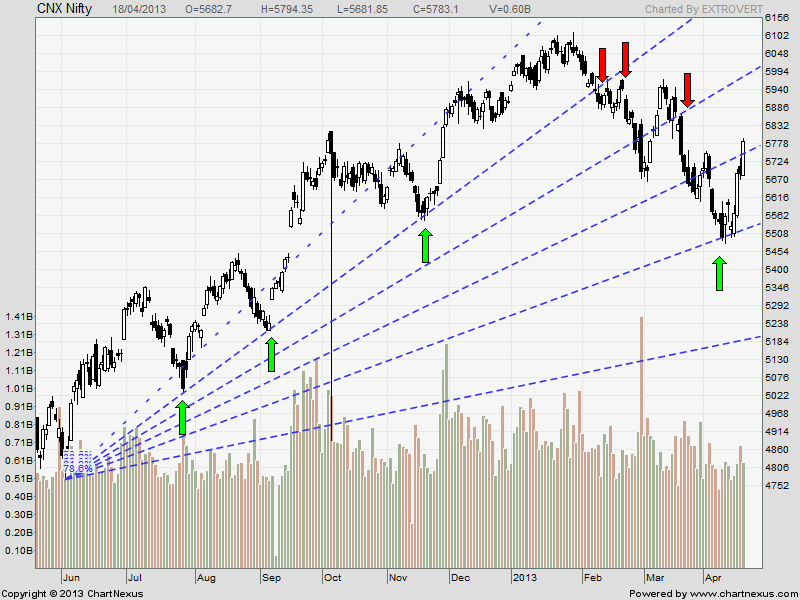
Nifty daily chart took exact support at Fibo Fans and bounced back as expected.
Fibo Retracement

As per of Fibo Retracement theory Nifty took resitane at 50% retracement of 5477-6112. Crossing the same on Monday can lead to next support of 5872
Nifty Weekly Chart
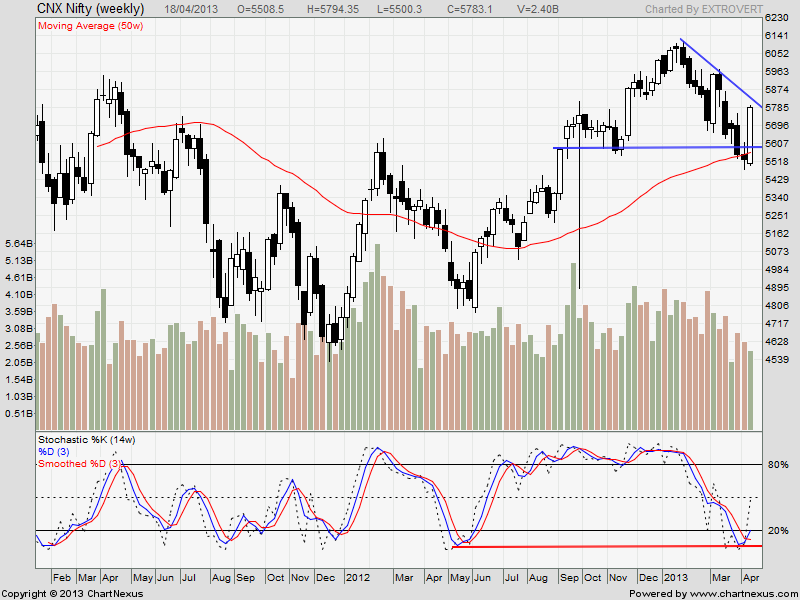

Trading Monthly charts

Monthly chart has formed an Hammer pattern which is a reversal pattern on larger time frame. Lets wait for follow up move.Monthly charts will become bullish above 5905.
Nifty Trading Levels
Nifty Trend Deciding Level:5830
Nifty Resistance:5872,5903 and 5971
Nifty Support:5753,5720 and 5676
Levels mentioned are Nifty Spot
Let me go by Disclaimer these are my personal views and trade taken on these observation should be traded with strict Sl
We do discussion is Live market to update Nifty levels If you are interested you can LIKE the page to get Real Time Updates.
Follow on Facebook during Market Hours: https://www.facebook.com/pages/Brameshs-Tech/140117182685863