


Indian benchmark indices that have been precariously poised over the last two weeks began downward journey with persistent selling by FII’s. The Nifty has closed below the 5,600 level and the Sensex below 18,600, both below their 200 DMA ,Nifty ended down by 2.3% or 129 points WoW basis.Investors who bought shares with the hope of the Sensex and the Nifty rising to a new high soon appear to be capitulating now.
Last week we gave Trend Deciding level as 5703 achieved all 3 weekly targets on downside.
Nifty 4 Hourly Chart

Nifty 4 Hourly charts as per Fibo Regression Channels has taken support at the lowest channel,last time it took support we saw swift pullback,will this time repeat the history ?
Nifty Gaps
For Nifty traders who follow gap trading there are 1 trade gaps in the range of 5400-6000 and all other gaps got filled.
- 5872-5863
- 5525-5446
- 5672-5644 — Breakaway gap
Nifty Daily Chart
Nifty daily chart has taken support at 233 DMA as shown in below chart, 233 DMA is more significant than 200 DMA as its a very strong Fibo Number.Strong support exists at 5525 , holding the same bounce back can be seen, Else we are going to 5400 range.

Fibonacci technique
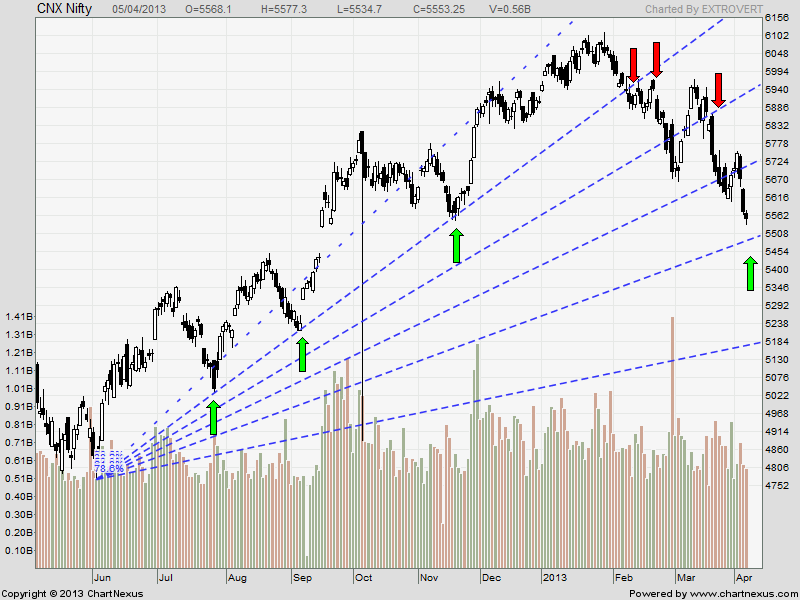
Nifty daily chart as per Fibo Fans break the support of 5703 formed a break away gap and is heading towards the next support of 5474.
Fibo Retracement

As per of Fibo Retracement theory strong support at 5511 which is 61.8% retracement holding and closing above the same bounceback can be seen till 5669.
Nifty Weekly Chart


Trading Monthly charts
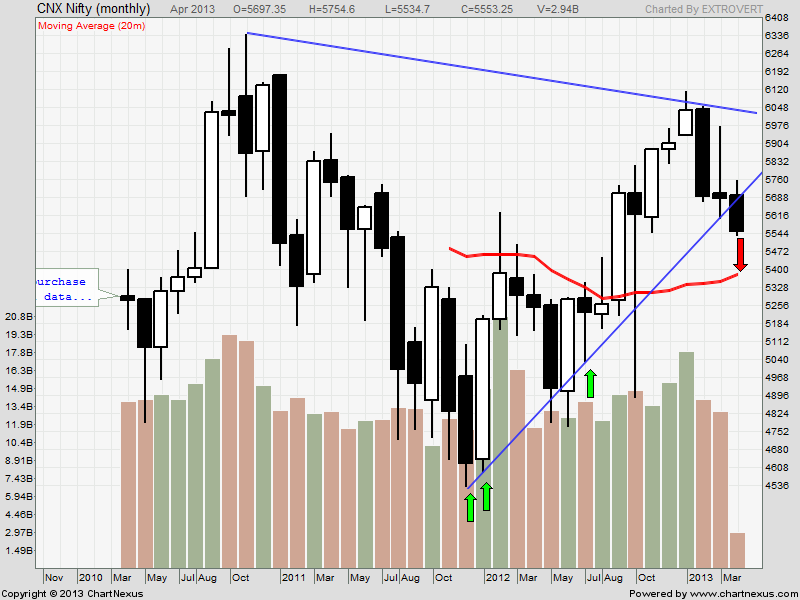
Monthly chart has been bearish from 6034 odd levels and 2 year old trend line is also broken. Next support comes at 5400 levels.
Nifty Trading Levels
Nifty Trend Deciding Level:5525
Nifty Resistance:5600,5644 and 5675
Nifty Support:5474,5435 and 5394
Levels mentioned are Nifty Spot
Let me go by Disclaimer these are my personal views and trade taken on these observation should be traded with strict Sl
We do discussion is Live market to update Nifty levels If you are interested you can LIKE the page to get Real Time Updates.
Follow on Facebook during Market Hours: https://www.facebook.com/pages/Brameshs-Tech/140117182685863
I can say in simple words that you have very good tech.of trading & if anybody who can do it systemattically can become very good trader with self-confidence.