


Gold and other commodities showed intense selling yesterday when Fed reserve member gave hint of Fed bond buying program can wind up if US keeps on improving. Gold is near a crucial 2 year support of $1526 and Silver near 26$, break of which can intensify technical selling. Lets analyse the technical chart of both Gold and Silver.
Gold
 Gold 4 Hour chart with Fibo regression channels,is shown Gold broken the important channel support of 1550 and made a low of 1541 as discussed last night in facebook post. Trend is still Sell on Rise till last swing high of 1555$ is not overtaken.
Gold Weekly

As per Weekly charts gold is nearing very important 2 year support of 1526 which has resulted in swift pullback last 3-4 times.Traders holding shorts can book out 60% of short near 1526 levels which should eventually come by today or tomorrow. Trend is Sell on Rise keeping strict SL of 1555$
Silver Hourly

Silver 4 Hour chart with Fibo regression channels,is shown Silver is holding the important channel support of 26.697 and bounced back. Resistance on Upside comes at 27.305 Trend is still Sell on Rise till last swing high of 27.305$ is not overtaken.
Silver Weekly
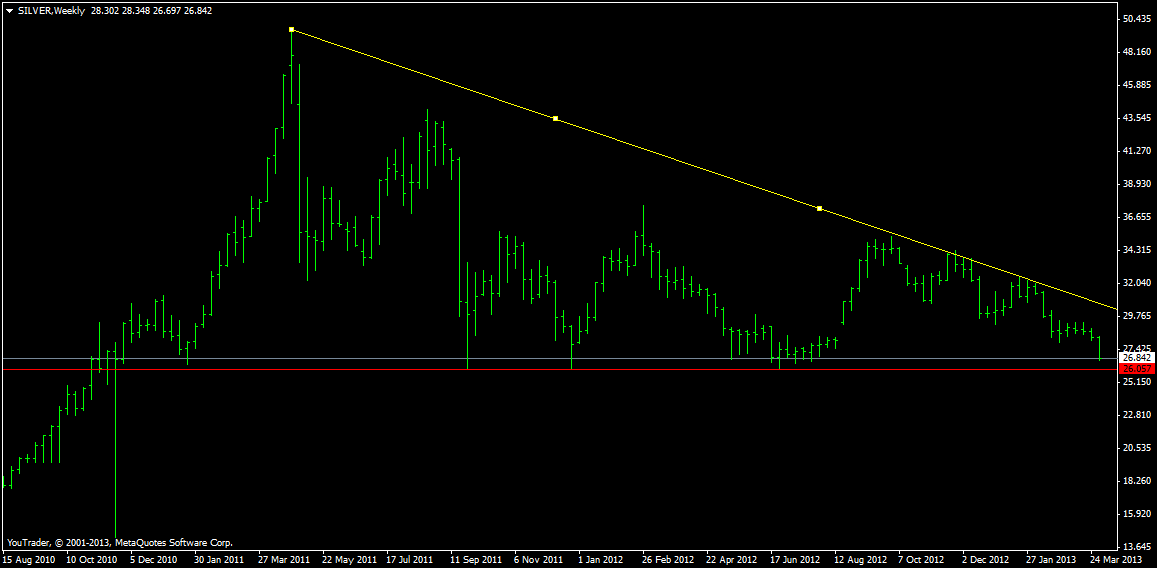
As per Weekly charts Silver is nearing very important 2 year support of $26 which has resulted in swift pullback last 3-4 times.Traders holding shorts can book out 60% of short near $26 levels which should eventually come by today or tomorrow. Trend is Sell on Rise keeping strict SL of $27.305