


For the reference of readers the performance sheet for the Month of April/March Expiry has been updated, can be accessed from http://tradingsystemperformance.blogspot.in/ .
- Calculation are based on trading with 1 lot of Stock Futures
- Rs 100 is deducted as Brokerage and Taxes
M&M

M&M share is near crucial support of 200 DMA @841. Stock has also broken its long term trendline and rises are getting sold into as seen in todays trading price action.
Buy above 849.5 Tgt 857,865 and 870 SL 844
Sell below 840 Tgt 836,829 and 819 SL 844
Tech M
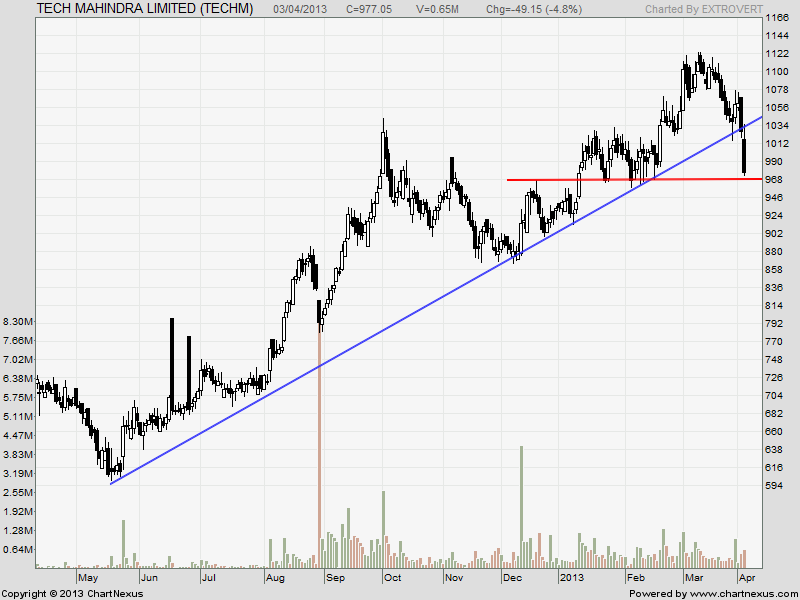 Tech M also broke its long term trendline tried to move over the trendline but got sold off. Stock is near an important supply zone of 972-965, unable to hold the support stock can extend the fall all the way to 920 odd levels in short term.
Sell below 972 Tgt 963,955 and 945 SL 977
Buy above 982 Tgt 989,995 and 1000 SL 977
DLF
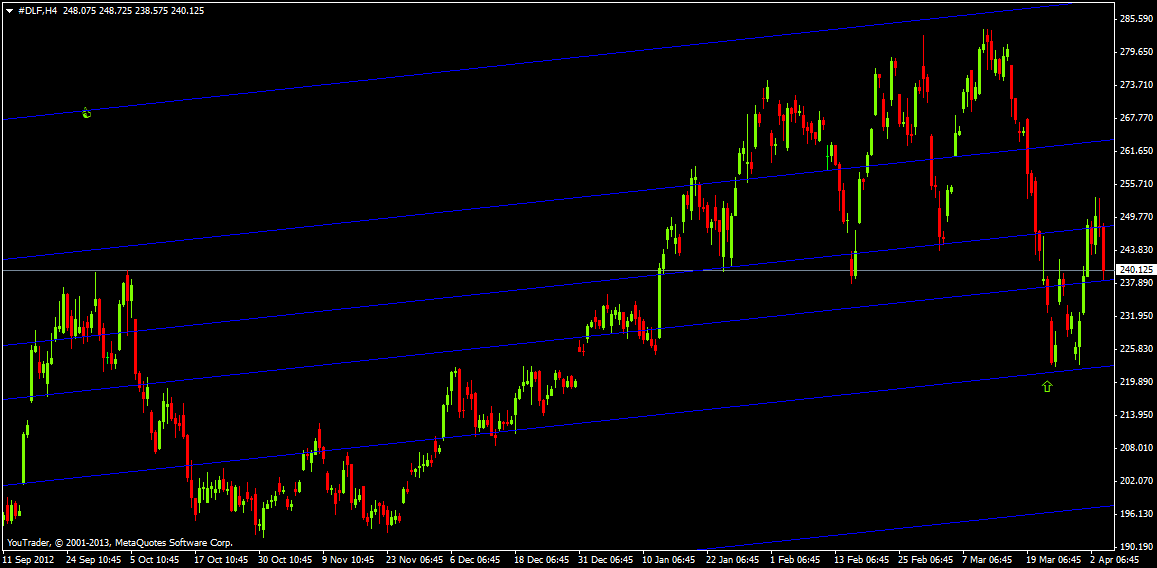
DLF has been giving good trading moves,4 hour DLF shows above show taking perfect support at liner regression channels.
Buy above 246.5 Tgt 248,251 and 254 SL 244.5
Sell below 243 Tgt 241.5,239.5 and 235 SL 244.5
- All prices relate to the NSE Spot
- Calls are based on the previous trading day’s price activity.
- The call is valid for the next trading session only unless otherwise mentioned.
- Stop-loss levels are given so that there is a level below/above, which the market will tell us that the call has gone wrong. Stop-loss is an essential risk control mechanism; it should always be there.
- Book, at least, part profits when the prices reach their targets; if you continue to hold on to positions then use trailing stops to lock in your profits.
We do discussion is Live market to update Nifty levels If you are interested you can LIKE the page to get Real Time Updates.
Follow on Facebook during Market Hours: http://www.facebook.com/pages/Brameshs-Tech/140117182685863