


Nifty gave then Highest Weekly Close in last 104 weeks,Closing comfortably above the sacrosanct level of 6000.Nifty and Sensex after 4 weeks of consolidation phase, finally gave a breakout .US Fiscal deal gave a booster to Bulls round the globe. As per our last week discussion do not try to second guess the market and Clients who follow our Trend Following system were rewarded handsomely. Next week we will get the CPI numbers which will be closely watched. Economic Calendar for Week Jan 07-11 http://bit.ly/113Zy5K
Trends in motion will stay in motion, they will persist, until they reverse.
Lets discuss Nifty Trading Strategy for Next week.
Nifty Hourly Chart
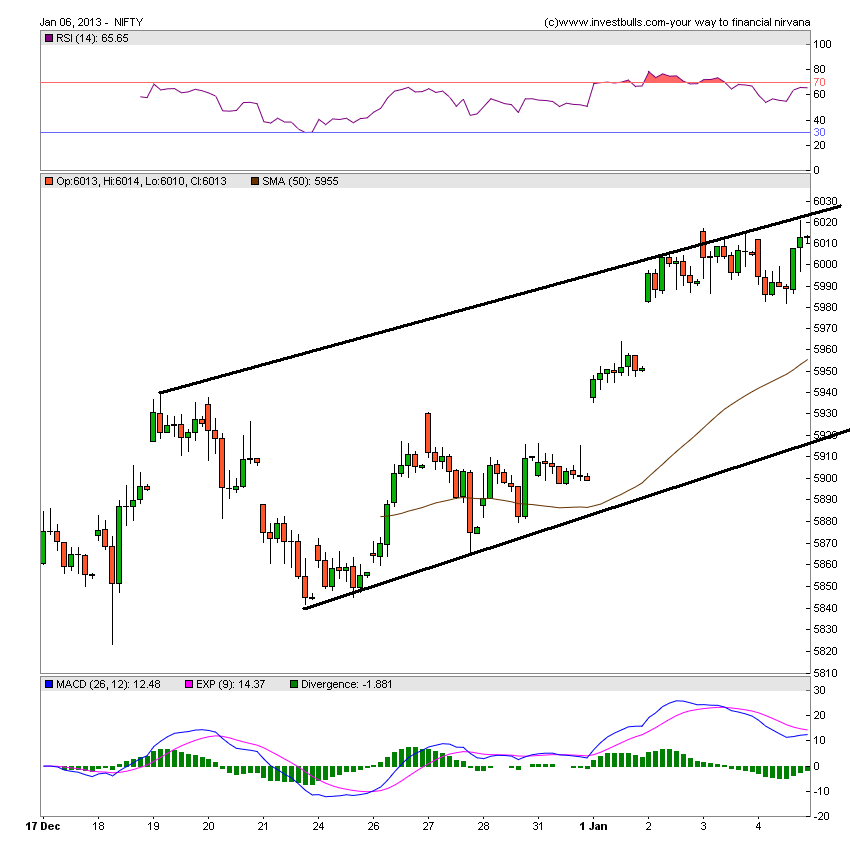
Finally 5930 and 5965 resistance were crossed but with gap up backed by news on Fiscal cliff. Nifty is trading comfortably above 50 SMA which lies at 5955. Negative divergences have been observed in Hourly chart but we need price confirmation till 5981 is not broken. Ride the horse in the direction it is going.
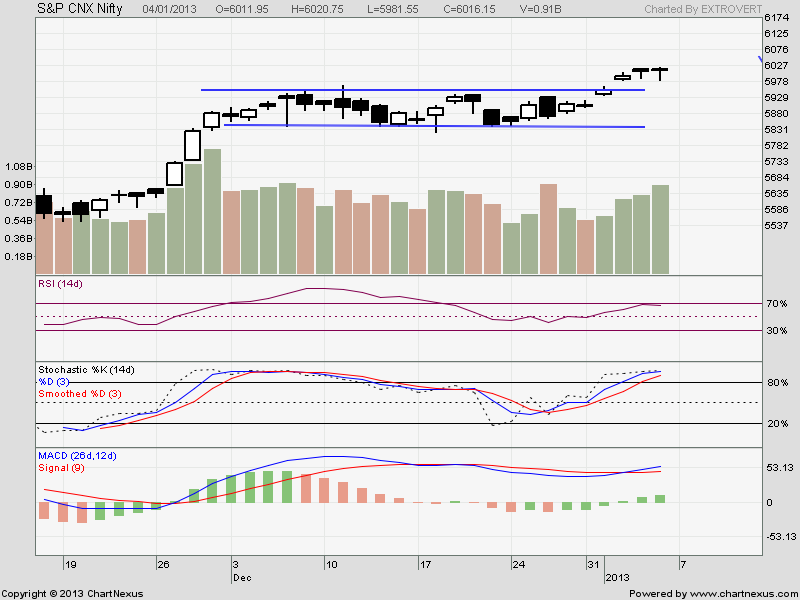
Nifty Gaps
For Nifty traders who follow gap trading there are 4 trade gaps in the range of 5077-5900.
- 5727-5736
- 5856-60
- 5870-5880
- 5951-5982
So these levels should be noted down carefully by Nifty trader to find further Nifty support and resistance.
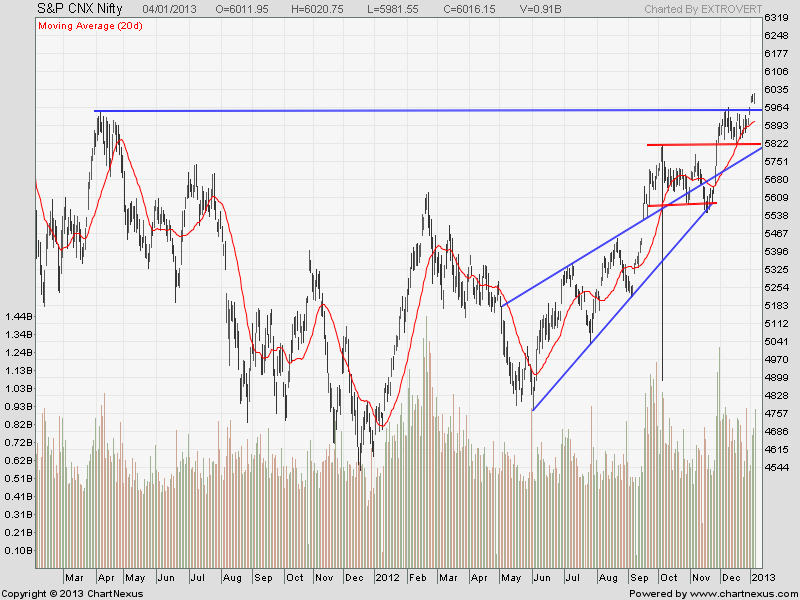
Nifty Daily Chart
At Last we can see a clear cut breakout in Nifty. After 21 days of consolidation in range of 5823-5965 finally nifty broken out of trading range that to with a gap up. Now Here the importance of following “a single ” system comes into play as soon as level was broken enter the trade without having second doubts in your mind. Consensus is building Nifty to cross all time high backed by heavy FII inflows. Beware of consensus when in stock market. Technically till 5920 is not broken market will continue with its trend .

FII has bought 25 Billion Dollar of equity in Indian markets in past 1 year but still rupee is trading at 54-55 range so macros of India fundamental have still not improved and this rally is again a liquidity driven rally, So i would advise investors to book out profit in rallies and wait for dips to enter again and Strict No to put money at such higher levels. For traders just follow the levels and play the market. Always remember market make 80% of move in 20% of times.
Nifty Daily Chart with Indicators
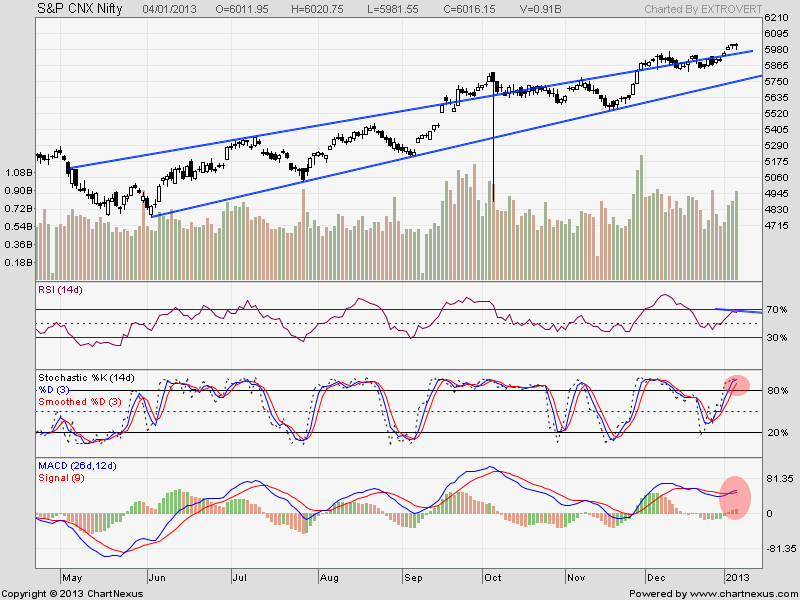
Nifty took out resistance at the top end of channel so 5930 with gap up and this become support now.Negative divergence is clearly visible on daily charts also. As Nifty made a new high of 6020 and RSI made a lower low.
Continue Reading for Weekly Charts and Weekly Levels
Let me go by Disclaimer these are my personal views and trade taken on these observation should be traded with strict Sl
We do discussion is Live market to update Nifty levels If you are interested you can LIKE the page to get Real Time Updates.
Follow on Facebook during Market Hours: http://www.facebook.com/pages/Brameshs-Tech/140117182685863