As discussed last week USD INR achieved all target above trend deciding level 56.USD is very near to ots life time high of 57.28 and any close above 56.75 will lead towards the life highs. Lets analyze USD INR technical for coming week.
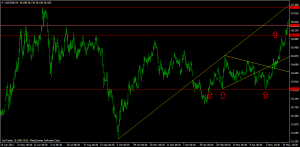
USD INR 4 Hour Chart
USD INR 4 hour chart has closed above the resistance of 56.4. Symmetrical triangle formed in H4 charts achieved its target. USD has formed a Breakaway gap last week and it signify more higher levels to come.
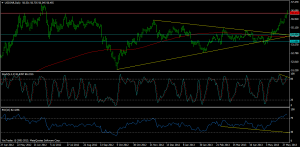
USD INR Daily Chart
As per Daily charts INR has closed above its 200 DMA which is bullish signal. Also it has closed above its symmetrical triangle which again shows a bullish picture. Target for Symmetrical triangle comes at 54.76+(55.84-52.88) =57.72. Negative divergence has started showing on Daily chart, confirmation will come once USD_INR starts trading below 56.00 which was breakaway gap zone.
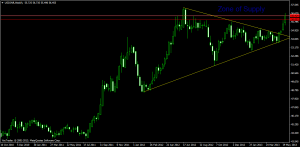
USD INR Weekly Chart
Weekly charts have broken the perfect symmetrical triangle above 54.76 .Closed above the demand zone of 56.4 above which it will make new life lows
USD – INR Trend Deciding Level:57.0500
USD – INR Resistance:57.31,57.80,58.50
USD – INR Support:56.55,56.05 and 55.30
Levels mentioned are USD – INR June Future
Follow on Facebook during Market Hours: http://www.facebook.com/pages/Brameshs-Tech/140117182685863


