


MCX COPPER Gann Angle Chart
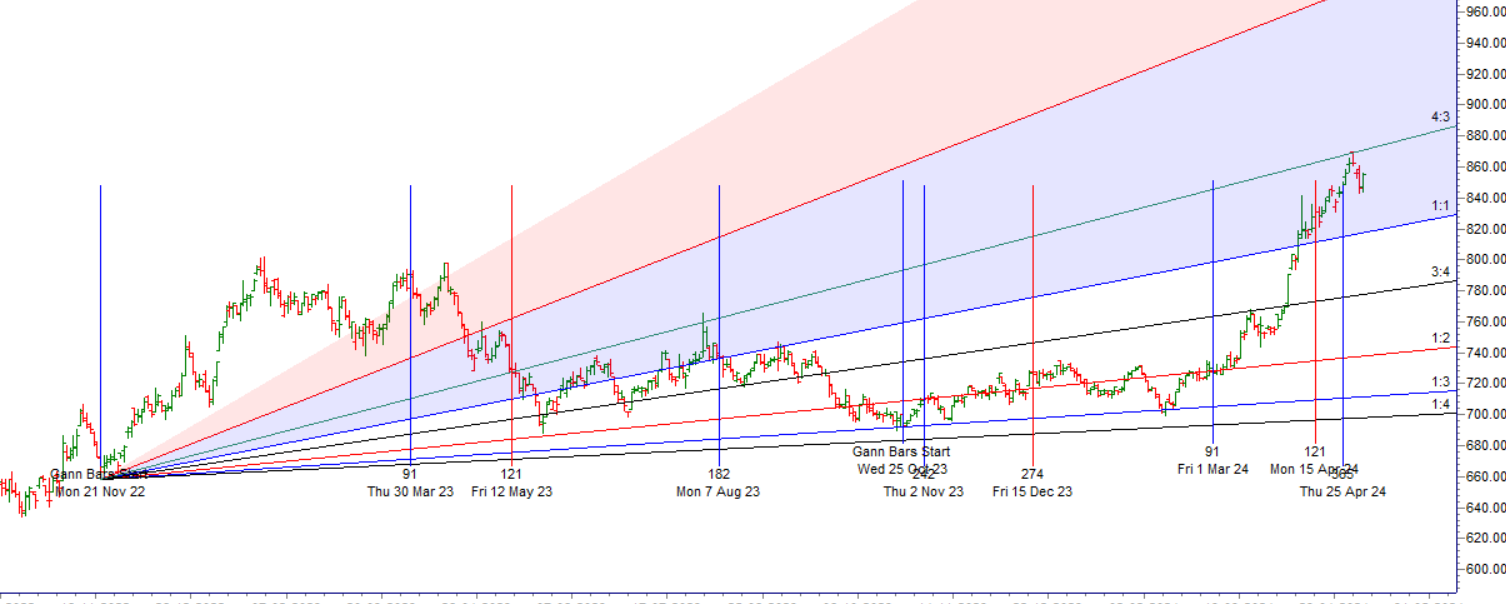
COPPER has reacted from its gann angle resistance zone of 870 confirming short term top is done.
MCX COPPER Supply Demand Zone
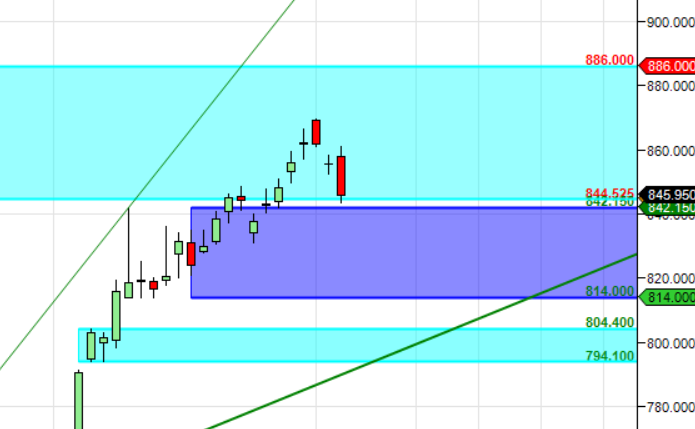
MCX COPPER Supply Demand Chart : Supply in range of 856-860, Demand in range of 836-832
MCX COPPER Harmonic Analysis

Alternate ABCD Pattern completed the pattern Now heading towards 836/830 once below 850.
COPPER Astro/Gann Trend Change Date
05 May Important Gann/Astro Date for Trend Change
Weekly Trend Change Level:856
Weekly Resistance:862,868,874,880
Weekly Support: 850,842,836,830
Levels Mentioned are for Current Month Future
As always, it’s essential to closely monitor market movements and make informed decisions based on a well-thought-out trading plan and risk management strategy. Market conditions can change rapidly, and it’s crucial to be adaptable and cautious in your approach.
Trade smartly and safely.