I am not a SEBI Registered Advisor, and the analysis provided on this website is intended solely for educational purposes. It is important to note that the information presented should not be construed as financial advice. We do not guarantee the accuracy or completeness of the content, and any decisions based on the information provided are at your own risk.
Please be aware that investing in financial markets involves inherent risks, and past performance is not indicative of future results. We, the authors and contributors, shall not be held responsible for any financial outcomes, including but not limited to profit or loss, arising from the use of the information on this website.
It is strongly recommended that you seek the advice of a qualified investment professional or a SEBI Registered Advisor before making any investment decisions. Your financial situation, risk tolerance, and investment goals should be carefully considered before implementing any strategies discussed on this platform.
Additionally, we may not be aware of your specific financial circumstances, and our content should not be considered a substitute for personalized advice. Always conduct thorough research and consult with your own investment advisor to ensure that any investment decisions align with your individual financial objectives.
By accessing and using the information provided on this website, you acknowledge and agree that you are solely responsible for your investment decisions. We disclaim any liability for any direct or indirect damages, including financial losses, that may result from the use of or reliance on the information presented here.


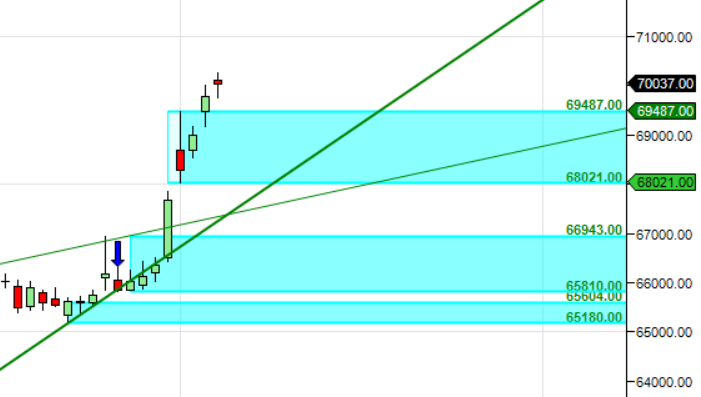
MCX GOLD Supply Demand Chart : Demand in range of 69487-69400 , Supply in range of 70040-70108/Weekly Resistance:70234,70497,40760 ???????
GOLD FUT ALREADY CLOSED AT 70636 ON LAST FRIDAY /YOU ARE GIVING SUPPLY/RES ZONE 70040-108/70234/70497 PL CONCENTRATE ON POSTING CORRECT LEVELS
its corrected