


Analysis of FIIs’ behavior in the Nifty Index Futures market shows a Bullish approach as they displayed a preference for LONG positions. On a net basis, FIIs went LONG 1660 contracts worth 180 crores, resulting in an increase of 6078 contracts in the Net Open Interest.
Tommrow we have Mars Ingress, Mars is plannet of Energy it will add energy to the move, Also we have an important Solar Eclipse date so be ready for another voaltile move tommrow. Nifty is nears its 3×4 Gann angle support,formed an Outside Bar and price has touched Octave point of 21630 . Fresh shorts below 21610 for a move towards 21470.
Nifty took support at 3×4 Gann angle and saw a smart recovery but failed to closed above 21750 SAP and 21830 Gann Monthly TC Level, Tommrow we have Mars Conjunct Pluto aspect which leads to major trend change and Solar Eclipse date which leads to big move as discussed below.Bulls need to protect 21500 which is 50 DMA after gap down. 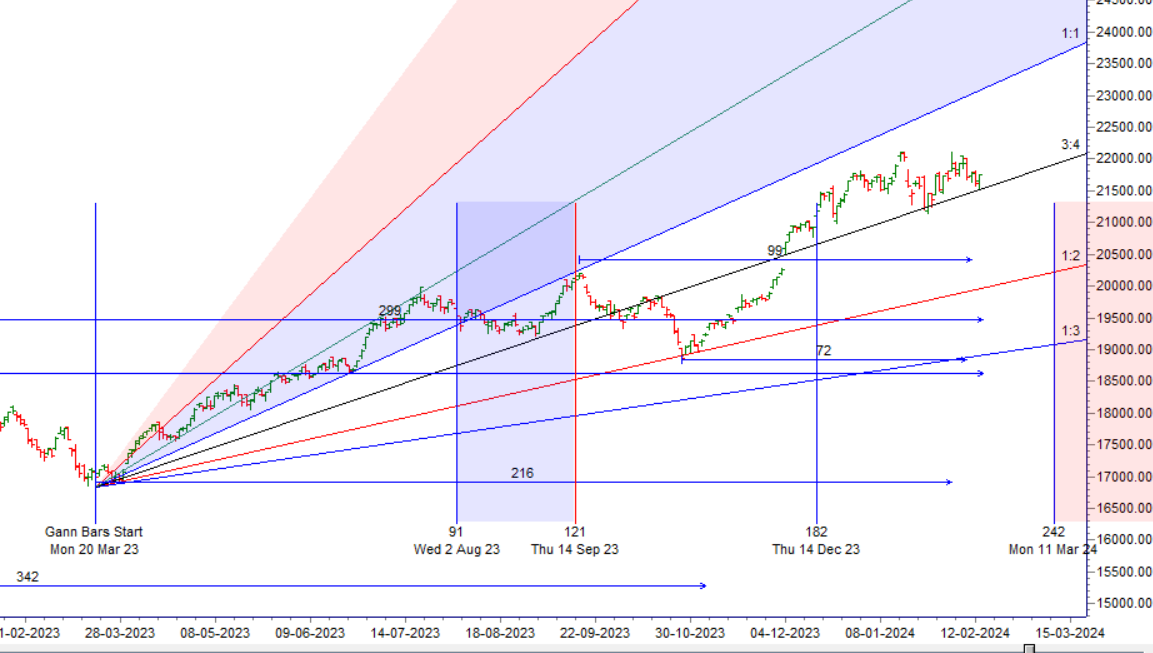
Nifty Trade Plan for Positional Trade ,Bulls will get active above 21610 for a move towards 21683/21757/21831 . Bears will get active below 21462 for a move towards 21388/21314/21240

Traders may watch out for potential intraday reversals at 10:15,11:14,12:08,01:42,02:49 How to Find and Trade Intraday Reversal Times
Nifty Feb Futures Open Interest Volume stood at 1.19 lakh cr , witnessing a addition of 1.44 Lakh contracts. Additionally, the increase in Cost of Carry implies that there was a addition of SHORT positions today.
Nifty Advance Decline Ratio at 36:14 and Nifty Rollover Cost is @21592 closed above it.
Nifty Gann Monthly Buy Trade level : 21915 and Gann Monthly Sell Trade level : 21646 — 21646 closed below it.
Nifty has closed below its above 20 DMA 21686 and 50 SMA @21499.

Nifty options chain shows that the maximum pain point is at 21500 and the put-call ratio (PCR) is at 0.82. Typically, when the PCR open interest ranges between 0.90 and 1.05, the market tends to remain range-bound.
Nifty 50 Options Chain Analysis
The Nifty 50 options chain indicates that the highest open interest (OI) on the call side is at the 21700 strike, followed by 21800 strikes. On the put side, the highest OI is at the 21600 strike, followed by 21500 strikes. This suggests that the market participants are expecting Nifty 50 to remain range between 21500-21800 levels.
In the cash segment, Foreign Institutional Investors (FII) bought 376 crores, while Domestic Institutional Investors (DII) bought 273 crores.
Traders who follow the musical octave trading path may find valuable insights in predicting Nifty’s movements. According to this path, Nifty may follow a path of 22467-21836-21205 This means that traders can take a position and potentially ride the move as Nifty moves through these levels.Of course, it’s important to keep in mind that trading is inherently risky and market movements can be unpredictable.

If you want to be a good trader “Be the Best Listener.” Listen To Market, Experienced Traders. If a losing trade sets you off, then this can affect your trades going forward. And this is dangerous. We call this trading on “tilt.”
For Positional Traders, The Nifty Futures’ Trend Change Level is At 21816 . Going Long Or Short Above Or Below This Level Can Help Them Stay On The Same Side As Institutions, With A Higher Risk-reward Ratio. Intraday Traders Can Keep An Eye On 21760, Which Acts As An Intraday Trend Change Level.
Nifty Intraday Trading Levels
Buy Above 21610 Tgt 21640, 21699 and 21729 ( Nifty Spot Levels)
Sell Below 21550 Tgt 21512, 21485 and 21444 (Nifty Spot Levels)
Wishing you good health and trading success as always.As always, prioritize your health and trade with caution.
As always, it’s essential to closely monitor market movements and make informed decisions based on a well-thought-out trading plan and risk management strategy. Market conditions can change rapidly, and it’s crucial to be adaptable and cautious in your approach.