


USDINR has changed gear. From making higher high and higher low, which denoted an uptrend, it has been forming lower lows and lower highs. This is a sign of a downtrend. We are yet to get momentum on the downside possibly due to RBI intervention. But once the momentum arrives, then we could see some fireworks on the downside, squeezing put option sellers
USD INR GANN Chart

USD INR broken gann angle support zone.
USD INR Supply Demand Zone
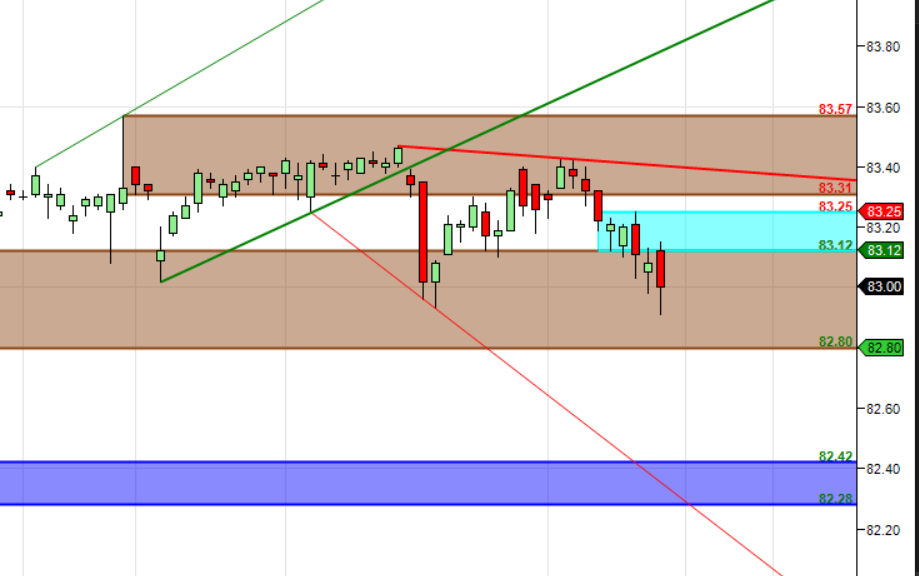
India Rupee Supply Demand Chart : Demand in range of 82.75-82.80, Supply in range of 83.15-83.230
USD INR Harmonic
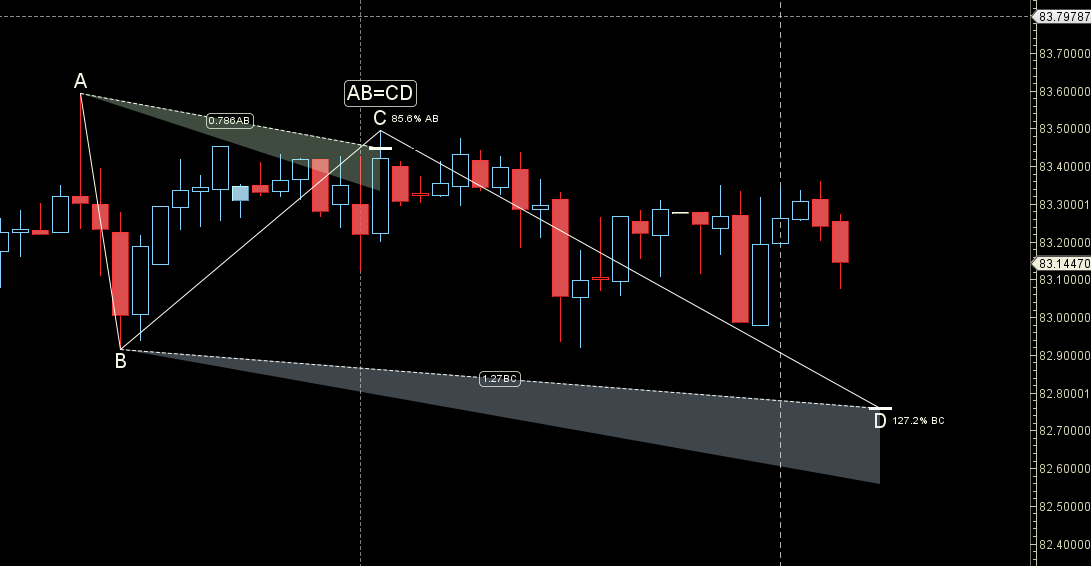
Price is forming the D Leg of SHARK Pattern heading towards 82.80/82.65 till below 83.25