


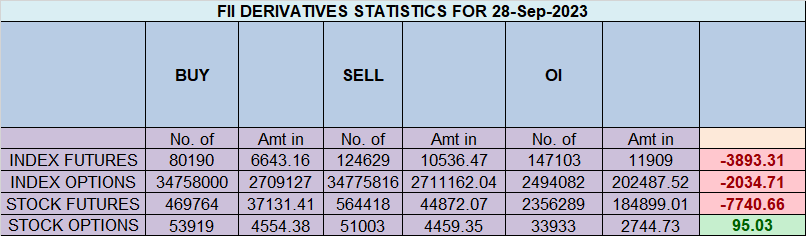
Analysis of FIIs’ behavior in the Nifty Index Futures market shows a Bearish approach as they displayed a preference for SHORT positions. On a net basis, FIIs went SHORT 29297 contracts worth 2878 crores, resulting in an decrease of 64200 contracts in the Net Open Interest.
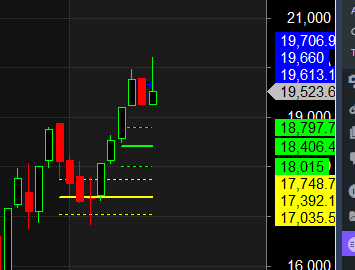
NIfty has completed its journey from 1 gann angle to another as shown in below chart, Thats the Beauty of Gann Angles , it helps in capturing the full move. 19550 was Gann MOnthly Trend Change Level Low made was extactly 19550 and saw a 200 points bounce, Today we have Moon at Perigee and Tommrow Moon Declination as Both Lunar Cycle are coming together we can see explosive move as discussed in below video, Intraday traders watch for first 15 mins High and Low to catch the trend for the day.
We got an excellent move yesterday based on Lunar Cycle , Now Today being NEW Moon and Moon Declination as discussed below also we have Monthly and Quaterly closing so bulls will try hard to close above 19629 and Bears below 19452-19400 range to form a gravestone doji on higher time frame.

Traders may watch out for potential intraday reversals at 9:39,11:30,12:47,2:20 How to Find and Trade Intraday Reversal Times
Nifty Sep Futures Open Interest Volume stood at 0.47 lakh cr , witnessing a liquidation of 15.9 lakh contracts. Additionally, the increase in Cost of Carry implies that there was a liquidation of SHORT positions today.
Nifty Advance Decline Ratio at 16:34 and Nifty Rollover Cost is @19768 and Rollover is at 70.4%.
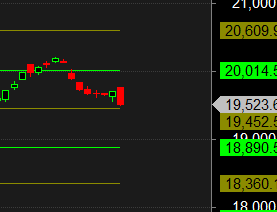
Nifty closed below 20/50/100 SMA and heading towads 19200 till we close below 19629

Nifty options chain shows that the maximum pain point is at 19500 and the put-call ratio (PCR) is at 0.83. Typically, when the PCR open interest ranges between 0.90 and 1.05, the market tends to remain range-bound.
Nifty 50 Options Chain Analysis
The Nifty 50 options chain indicates that the highest open interest (OI) on the call side is at the 19600 strike, followed by 197000 strikes. On the put side, the highest OI is at the 19500 strike, followed by 19400 strikes. This suggests that the market participants are expecting Nifty 50 to remain range between 19400 -19600 levels.Total Call OI is 4.95 cr and Total Put OI is 2.58 cr
In the cash segment, Foreign Institutional Investors (FII) sold 3364 crores, while Domestic Institutional Investors (DII) bought 2711 crores.
Traders who follow the musical octave trading path may find valuable insights in predicting Nifty’s movements. According to this path, Nifty may follow a path of 18890-19452-20014 This means that traders can take a position and potentially ride the move as Nifty moves through these levels.Of course, it’s important to keep in mind that trading is inherently risky and market movements can be unpredictable.Price has closed below 20014 heading towards 19452
To create money management, position size calculation or the elaboration of a profitable set of rules. All of these very useful tools are of little help if you are not able to use them in a disciplined manner.
For Positional Traders, The Nifty Futures’ Trend Change Level is At 19860 . Going Long Or Short Above Or Below This Level Can Help Them Stay On The Same Side As Institutions, With A Higher Risk-reward Ratio. Intraday Traders Can Keep An Eye On 19701, Which Acts As An Intraday Trend Change Level.
Nifty Intraday Trading Levels
Buy Above 19558 Tgt 19594, 19629 and 19666 ( Nifty Spot Levels)
Sell Below 19500 Tgt 19475, 19450 and 19424 (Nifty Spot Levels)
Wishing you good health and trading success as always.As always, prioritize your health and trade with caution.
As always, it’s essential to closely monitor market movements and make informed decisions based on a well-thought-out trading plan and risk management strategy. Market conditions can change rapidly, and it’s crucial to be adaptable and cautious in your approach.
Dear Sir,
Appreciate you for ur kindness and efforts as always,