


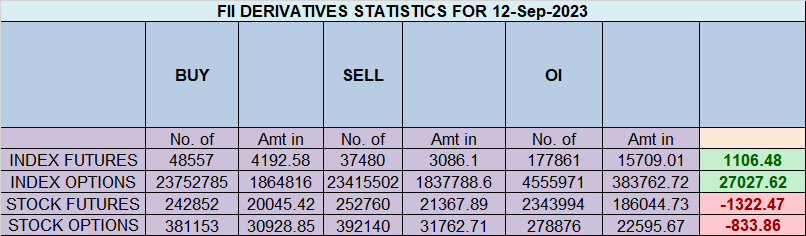
Analysis of FIIs’ behavior in the Nifty Index Futures market shows a Bullish approach as they displayed a preference for LONG positions. On a net basis, FIIs went LONG 10845 contracts worth 1088crores, resulting in an increase of 6695 contracts in the Net Open Interest.
- “Bayer Rule 2: Trend goes down within 3 days when the speed difference between Mars and Mercury is 59 minutes. Leads to Big Move “
- Venus Conjunct Mercury HELIO
- Moon Conjunction Saturn
- Moon Apogee
For Intraday Traders watch for first 15 mins high and low to capture the trend of the day.
Nifty Trade Plan for Positional Trade ,Bulls will get active above 20025 for a move towards 20085/20166/20225/20300. Bears will get active below 19937 for a move towards 19867/19797/19727
Traders may watch out for potential intraday reversals at 9:40,10:28,11:24,1:48,2:07 How to Find and Trade Intraday Reversal Times
Nifty Sep Futures Open Interest Volume stood at 1.01 lakh cr , witnessing a addition of 5.2 lakh contracts. Additionally, the increase in Cost of Carry implies that there was a addition of LONG positions today.
Nifty Advance Decline Ratio at 16:34 and Nifty Rollover Cost is @19445 and Rollover is at 74.1 %.
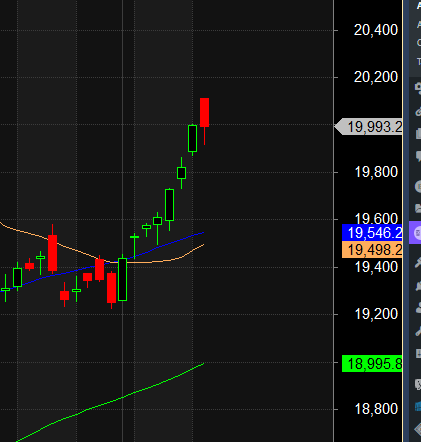
Nifty has closed above all 20/50 SMA till 19550 is protected Bulls have upper hand.
Nifty options chain shows that the maximum pain point is at 20000 and the put-call ratio (PCR) is at 0.9. Typically, when the PCR open interest ranges between 0.90 and 1.05, the market tends to remain range-bound.
Nifty 50 Options Chain Analysis
The Nifty 50 options chain indicates that the highest open interest (OI) on the call side is at the 20100 strike, followed by 20200 strikes. On the put side, the highest OI is at the 19900 strike, followed by 19800 strikes. This suggests that the market participants are expecting Nifty 50 to remain range between 19800 -20200 levels.
In the cash segment, Foreign Institutional Investors (FII) sold 1047 crores, while Domestic Institutional Investors (DII) bought 259crores.
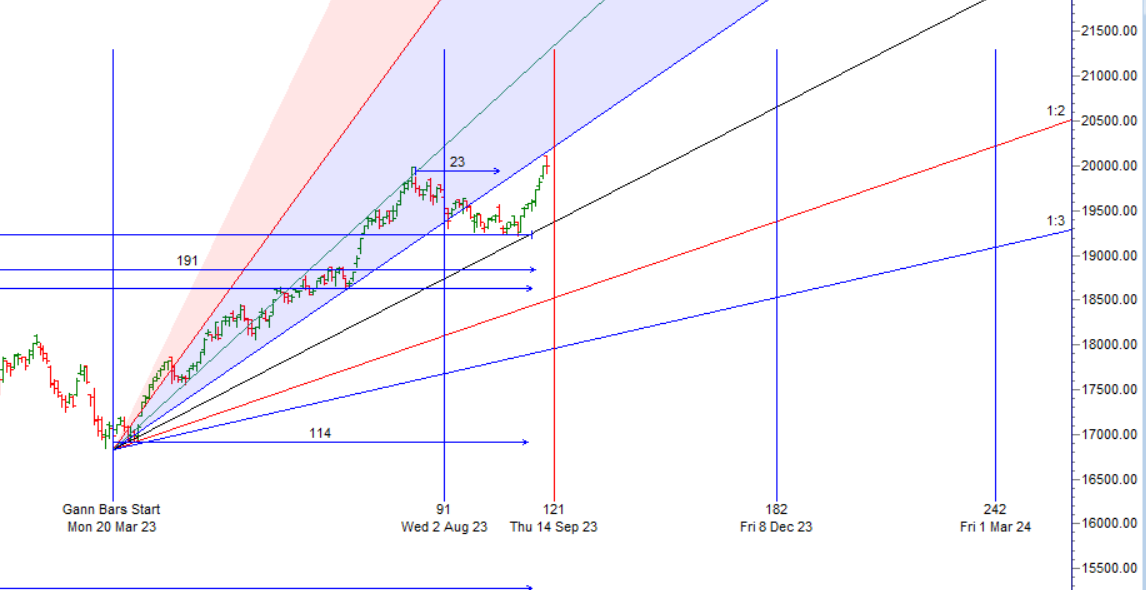
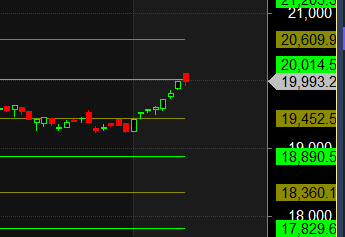
Traders who follow the musical octave trading path may find valuable insights in predicting Nifty’s movements. According to this path, Nifty may follow a path of 18890-19452-20014 This means that traders can take a position and potentially ride the move as Nifty moves through these levels.Of course, it’s important to keep in mind that trading is inherently risky and market movements can be unpredictable.Price has reached 20014
Trading requires discipline, humility, and a willingness to learn from others, and disrespecting the market would only result in the market not respecting him back.
For Positional Traders, The Nifty Futures’ Trend Change Level is At 19698. Going Long Or Short Above Or Below This Level Can Help Them Stay On The Same Side As Institutions, With A Higher Risk-reward Ratio. Intraday Traders Can Keep An Eye On 20053 , Which Acts As An Intraday Trend Change Level.
Nifty Intraday Trading Levels
Buy Above 20025 Tgt 20050, 20075 and 20100 (Nifty Spot Levels)
Sell Below 19936 Tgt 19905, 19864 and 19816 (Nifty Spot Levels)
Wishing you good health and trading success as always.As always, prioritize your health and trade with caution.
As always, it’s essential to closely monitor market movements and make informed decisions based on a well-thought-out trading plan and risk management strategy. Market conditions can change rapidly, and it’s crucial to be adaptable and cautious in your approach.