


Foreign Institutional Investors (FIIs) displayed a Bullish approach in the Nifty Index Futures market by shorting 10742 contracts worth 1013 crores, resulting in a decrease of 2530 contracts in the Net Open Interest. FIIs sold 7633 long contracts and added 6538 short contracts , indicating a preference for covering LONG and adding SHORT positions .With a Net FII Long Short ratio of 1.04 FIIs utilized the market fall to exit Long positions and enter short positions in NIFTY Futures.
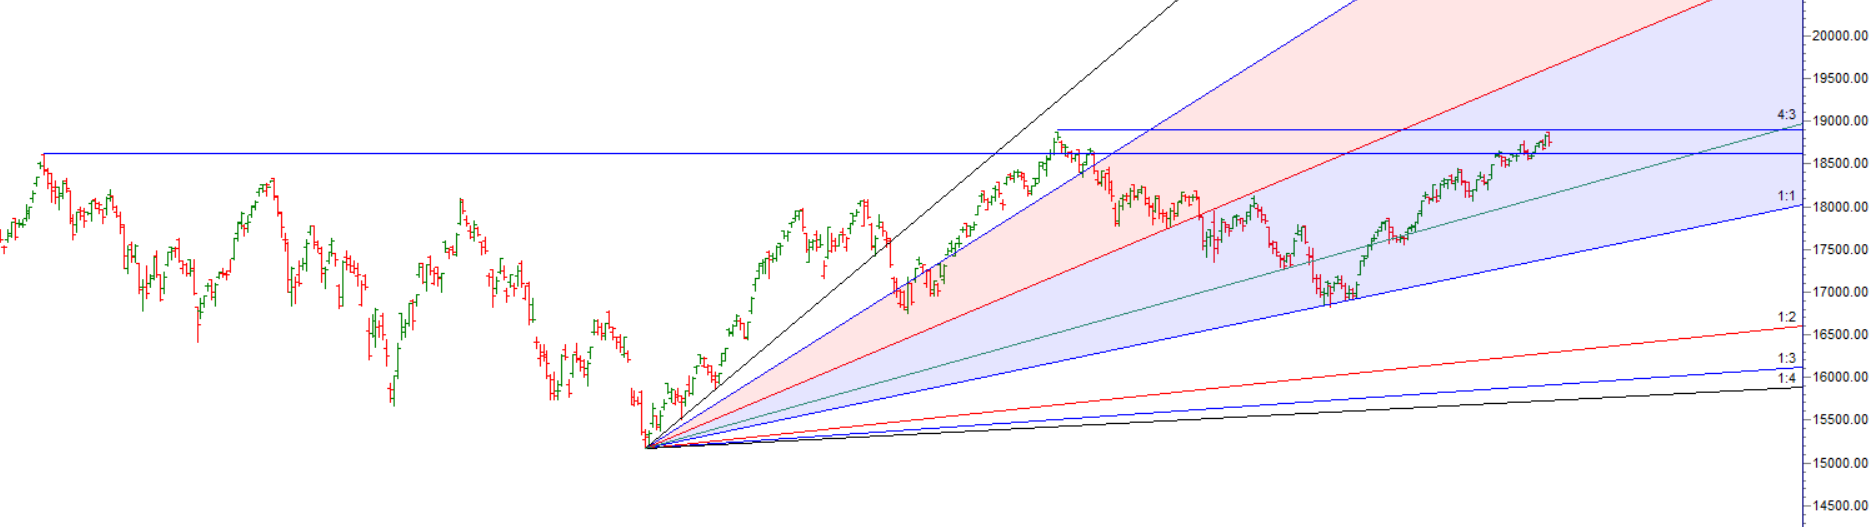
As Discussed in Last Analysis Nifty saw a rally but failed to close above its all time high of 18888. We have important astro events happening on Weekend
- Bayer Rule 27: Big tops and big major bottoms are when Mercury’s speed in Geocentric longitude is 59 minutes or 1 degree 58 minutes.
- NEW MOON
- SATURN RETROGRADE
Monday First 15 mins High and Low will guide for the day.
Nifty broke the first 15 mins low and saw decline through out the day with Saturn Retrograde showing its impact. Nifty has formed Double Top also today if its not able to cross 18888.
Gann Rules Says : Don’t ignore a Double Top & Triple Top signal on a monthly chart, after a minimum gap of 6 months. (Not the right place for investment/entry, the price may fall).
Nifty Trade Plan Based on Astro Indicator Bulls will get active above 18890 for a move towards 18971/19052. Bears will get active below 18709 for a move towards 18628/18547/18466.

Traders may watch out for potential intraday reversals at 9:38,10:31,11:39,2:28 How to Find and Trade Intraday Reversal Times
Nifty June Futures Open Interest Volume stood at 0.99 lakh, witnessing a liquidation of 2.3 lakh contracts. Additionally, the increase in Cost of Carry implies that there was a covering of LONG positions today.
Nifty Advance Decline Ratio at 14:36 and Nifty Rollover Cost is @18407 and Rollover is at 66.8%.
Major Support for Nifty us at 18585 ad@ 20 SMA

Nifty options chain shows that the maximum pain point is at 18750 and the put-call ratio (PCR) is at 1.04 . Typically, when the PCR open interest ranges between 0.90 and 1.05, the market tends to remain range-bound.
Nifty 50 Options Chain Analysis
The Nifty 50 options chain indicates that the highest open interest (OI) on the call side is at the 18800 strike, followed by 18900 strikes. On the put side, the highest OI is at the 18700 strike, followed by 18600 strikes. This suggests that the market participants are expecting Nifty 50 to remain range between 18800-18600 levels.
According To Todays Data, Retailers Have bought 181 K Call Option Contracts And 144 K Call Option Contracts Were Shorted by them. Additionally, They bought 300 K Put Option Contracts And 407 K Put Option Contracts were Shorted by them, Indicating A BULLISH Bias.
In Contrast, Foreign Institutional Investors (FIIs) bought 24 K Call Option Contracts And 64 K Call Option Contracts Were Shorted by them. On The Put Side, FIIs sold 8.6 K Put Option Contracts And 50 K Put Option Contracts were Shorted by them, Suggesting They Have Turned To BEARISH Bias.
In the cash segment, Foreign Institutional Investors (FII) sold 1030 crores, while Domestic Institutional Investors (DII) bought 365 crores.
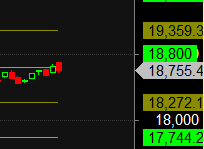
Traders who follow the musical octave trading path may find valuable insights in predicting Nifty’s movements. According to this path, Nifty may follow a path of 17744-18272-18800 This means that traders can take a position and potentially ride the move as Nifty moves through these levels.Of course, it’s important to keep in mind that trading is inherently risky and market movements can be unpredictable. Price has closed below 18800 can head towards 18272
If you want to paint like Leonardo da Vinci, first you need to learn to think like him. Because where the mind goes, everything else will eventually follow.
For Positional Traders, The Nifty Futures’ Trend Change Level is At 18689 . Going Long Or Short Above Or Below This Level Can Help Them Stay On The Same Side As Institutions, With A Higher Risk-reward Ratio. Intraday Traders Can Keep An Eye On 18850, Which Acts As An Intraday Trend Change Level.