


Foreign Institutional Investors (FIIs) displayed a Bearish approach in the Bank Nifty Index Futures market by SHORTING 1101 contracts worth 122 crores, resulting in a increase of 1301 contracts in the Net Open Interest.
As Discussed in Last Analysis
Bank NIfty has formed 3 Dojis within prior range suggesting price compression before the event. We have RBI Policy today try to trade after 10:30 AM when results on Intrest Rate are out, Yesterday Japan Market saw a correction of around 2% fall was swift and furious, Bull market correction are swift and fast, so keep your TSL in the system. Today we have Venus Square North Node aspect so expect decent volatality in the market.
Venus Square North Node aspect showed its impact with nIfty seeing a small correction and price back to gann angle support and formed an OUTSIDE BAR Pattern.
The Outside Bar candlestick pattern is a popular chart pattern used in technical analysis. It consists of two consecutive candles, where the second candle completely engulfs the range of the preceding candle. Here are the key characteristics of the Outside Bar pattern:
- Bullish Outside Bar: In a bullish context, the first candle is a bearish candle, followed by a larger bullish candle that engulfs the entire range of the previous candle. This pattern suggests a potential reversal from bearish to bullish momentum.
- Bearish Outside Bar: In a bearish context, the first candle is a bullish candle, followed by a larger bearish candle that engulfs the entire range of the previous candle. This pattern indicates a possible reversal from bullish to bearish momentum.
The Outside Bar pattern is considered significant because it demonstrates a shift in market sentiment. It suggests that the buyers or sellers have gained control and can potentially lead to a continuation of the newly established trend. Traders often use this pattern as a signal to enter or exit trades, depending on the direction of the pattern and the overall market conditions.
However, it’s important to remember that candlestick patterns should not be used in isolation for trading decisions. It is advisable to consider other technical indicators, price action, and fundamental analysis to confirm the signals provided by the Outside Bar pattern before making any trading decisions.
Bayer Rule 2: Trend goes down within 3 days when the speed difference between Mars and Mercury is 59 minutes. Leads to Big Move watch for 15 mins High and Low to capture trend for the day.

Trade Plan as per Outside Bar Bulls will get active above 44059 for a move towards 44188/44330/44665 Bears will get active below 43789 for a move towards 43647/43444/43247

Traders may watch out for potential intraday reversals at 9:40,11:08,12:18,1:22 How to Find and Trade Intraday Reversal Times
Bank Nifty June Futures Open Interest Volume stood at 23.9 lakh, addition of 0.6lakh contracts. Additionally, the decrease in Cost of Carry implies that there was a addition of SHORT positions today.
Bank Nifty Advance Decline Ratio at 4:8 and Bank Nifty Rollover Cost is @43908 and Rollover is at 72.2%
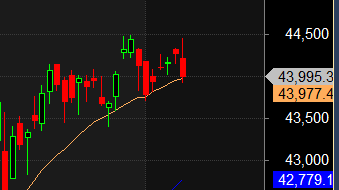
Major Support for Bank Nifty us at 43977 which is 20 SMA, This is 3 time bank nifty is touching its 20 SMA if it break this with gap down we are heading towards 50 SMA. @42779.
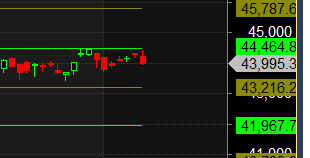
Traders who follow the musical octave trading path may find valuable insights in predicting Bank Nifty’s movements. According to this path, Bank Nifty may follow a path of 40789-41967-43216 . This means that traders can take a position and potentially ride the move as Bank Nifty moves through these levels. Of course, it’s important to keep in mind that trading is inherently risky and market movements can be unpredictable. Price is has broken 43216 Heading towards 44464 — 44464 done
According to the Bank Nifty options chain, the call side has the highest open interest (OI) at the 44000 strike, followed by the 44500 strike. On the put side, the 43500 strike has the highest OI, followed by the 44000 strike. This indicates that market participants anticipate Bank Nifty to stay within the 43500-44000 range.
The Bank Nifty options chain shows that the maximum pain point is at 44000 and the put-call ratio (PCR) is at 0.8. Typically, when the PCR open interest ranges between 0.90 and 1.05, the market tends to remain range-bound. PCR is on extreme end suggesting we can see sharp reversal .
Don’t overtrade. It’s tempting to trade frequently, but this can lead to losses. It’s better to trade less and focus on making high-quality trades.
For Positional Traders, The Bank Nifty Futures’ Trend Change Level is At 44185 . Going Long Or Short Above Or Below This Level Can Help Them Stay On The Same Side As Institutions, With A Higher Risk-reward Ratio. Intraday Traders Can Keep An Eye On 44346 , Which Acts As An Intraday Trend Change Level.