Foreign Institutional Investors (FIIs) displayed a Bearish approach in the Index Futures market by Shorting 15957 contracts worth 1451 crores, resulting in a increase of 1663 contracts in the Net Open Interest. FIIs sold 7147 long contracts and added 8810 short contracts, indicating a preference for added positions in Long and Short. With a Net FII Long Short ratio of 0.84 , FIIs utilized the market fall to exit long positions and enter short positions in Index Futures.
As discussed in Last Analysis Nifty has made bottom on 20 March at 16828 and High made today was 18180 Nifty has rallied 1352 points in 43 calendar days. VIX has seen rise of 10% today, We have 2 Important Aspect Forming tommrow
- Jupiter 51 Saturn — Impact Long term cycle
- Venus Semi Square Mercury– Useful for Short term trend change
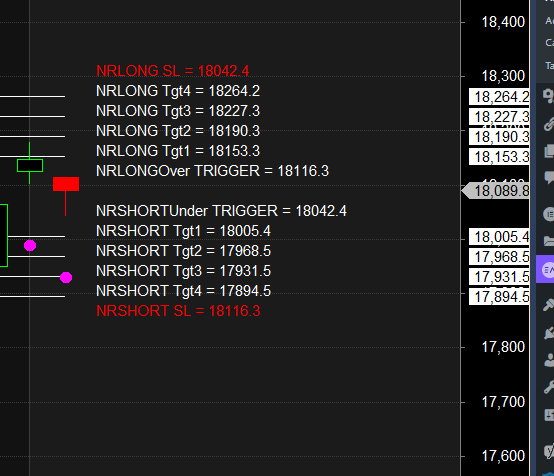
We have discussed Importance of Both Aspects with Nifty forming NR7 pattern pre FOMC suggesting we can see big volatile move in next 2 trading sessions. For Bears to become active price need to close below 18025 on 15 mins time frame for a move towards 17900 . Price has reached 1×2 Gann Angle as shown in below chart.
Nifty after 9 Days closed below the previous Day Low potentially forming evening star pattern and today being an important astro date. We will see FOMC decision Today FOr any reversal to take place bears need a close below 18025.
An evening star is a stock-price chart pattern used by technical analysts to detect when a trend is about to reverse. It is a bearish candlestick pattern consisting of three candles: a large white candlestick, a small-bodied candle, and a red candle.

For Swing Traders Break of 18101 can see a fall towards 18062/18023/17984/17944. Bulls will get active above 18181 for a move towards 18219/18258/18298/18337

Traders may watch out for potential intraday reversals at 9:40,10:11,11:47,12:54,2:34 How to Find and Trade Intraday Reversal Times
Nifty May Futures Open Interest Volume stood at 0.95 lakh, witnessing a liuidation of 0.13 lakh contracts. Additionally, the increase in Cost of Carry implies that there was a addition of Long positions today.
Nifty Rollover Cost is @17885 and Rollover is at 58.7 %
Nifty options chain shows that the maximum pain point is at 18100 and the put-call ratio (PCR) is at 0.95. Typically, when the PCR open interest ranges between 0.90 and 1.05, the market tends to remain range-bound.
According To Todays Data, Retailers Have bought 519901 Call Option Contracts And 558757 Shorted Call Option Contracts Were covered by them. Additionally, They bought 317304 Put Option Contracts And 363206 Put Option Contracts were added by them, Indicating A BULLISH Outlook.
In Contrast, Foreign Institutional Investors (FIIs) bought 48138 Call Option Contracts And 312 Shorted Call Option Contracts Were covered by them. On The Put Side, FIIs bought 103587 Put Option Contracts And 64458 Put Option Contracts were Shorted by them, Suggesting They Have Turned To A BEARSIH Bias.
Nifty 50 Options Chain Analysis
The Nifty 50 options chain indicates that the highest open interest (OI) on the call side is at the 18100 strike, followed by 18200 strikes. On the put side, the highest OI is at the 18000 strike, followed by 17900 strikes. This suggests that the market participants are expecting Nifty 50 to remain range between 17900-18200 levels.
In the cash segment, Foreign Institutional Investors (FII) bought 1338 crores, while Domestic Institutional Investors (DII) sold 583 crores.
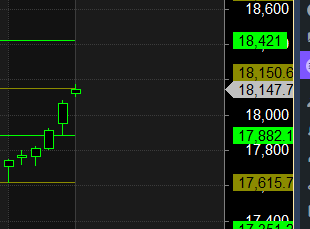
Traders who follow the musical octave trading path may find valuable insights in predicting Nifty’s movements. According to this path, Nifty may follow a path of 17882-18150 This means that traders can take a position and potentially ride the move as Nifty moves through these levels.Of course, it’s important to keep in mind that trading is inherently risky and market movements can be unpredictable. Price has come near 18150

You need to absorb losses if you cannot absorb string of loss how you can really last in this kind of business.
For Positional Traders, The Nifty Futures’ Trend Change Level is At 18088. Going Long Or Short Above Or Below This Level Can Help Them Stay On The Same Side As Institutions, With A Higher Risk-reward Ratio. Intraday Traders Can Keep An Eye On 18140 , Which Acts As An Intraday Trend Change Level.
