


Poor US GDP statistics caused a moderate sell-off in global equity markets and a rally for US Treasury bonds. Lower yields have not dampened demand for the US dollar, which is being supported by a risk-off environment. The USDINR has not exhibited the expected strength following a congestion breakout near 82.15. Nevertheless, the bias and drift remain positive as long as the pair remains above 81.83 levels on spot. When a range breaks, traders who are either caught short or waiting to participate in the move provide considerable upward impetus. When these players are absent, breakouts fail to establish the necessary momentum.
USD INR Gann Angle Chart
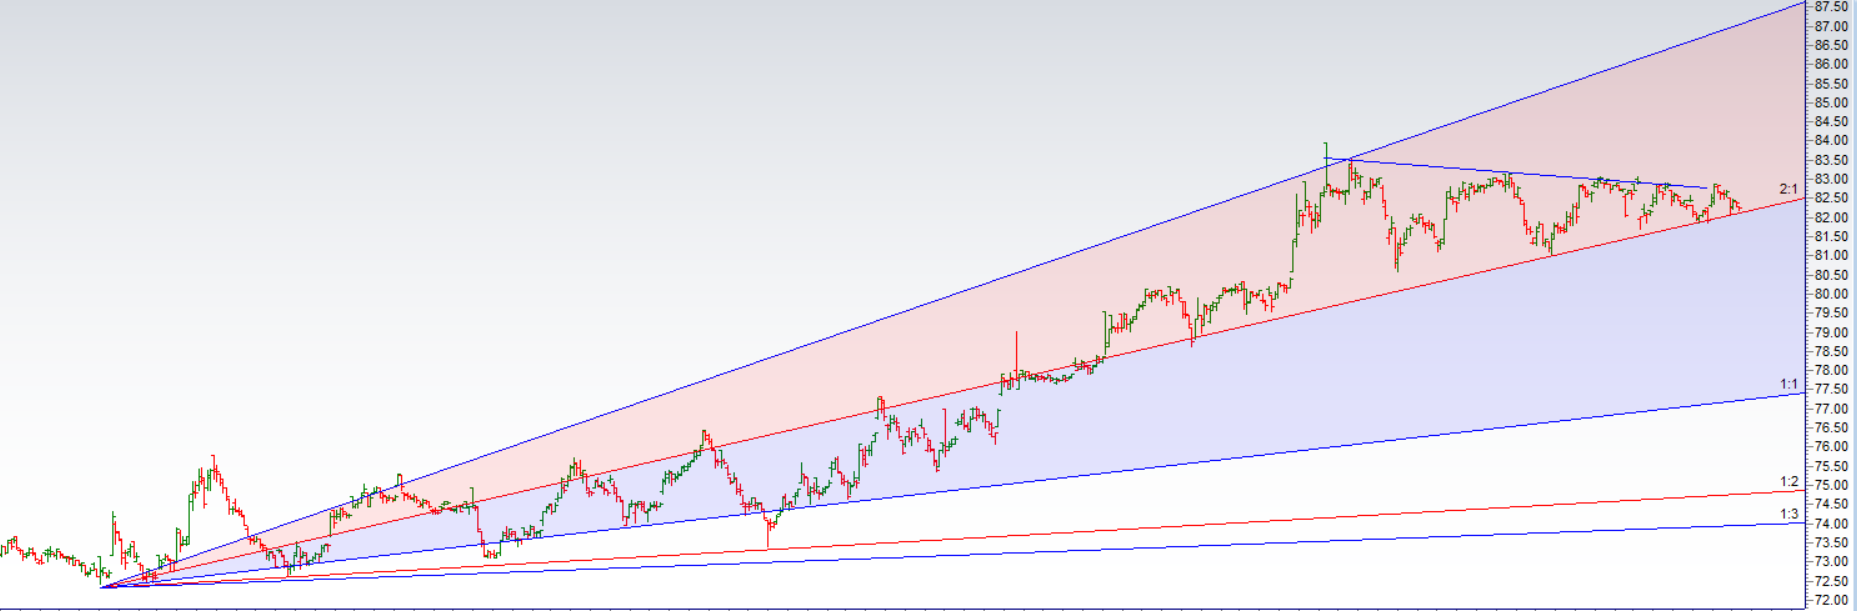
The price continues to get rejected from the resistance level of 83 and is taking multiple supports at the 2×1 Gann angle. USDINR remains in a range between 82 and 82.50 levels. In the event that prices break below 82 and sustain, they may test 81.50 and 81.25 levels.
USD INR Plannetary Support and Resistance Line

Indain Rupee is below Venus Plannetary line heading towards 81.50/81.25
USD INR Harmonic
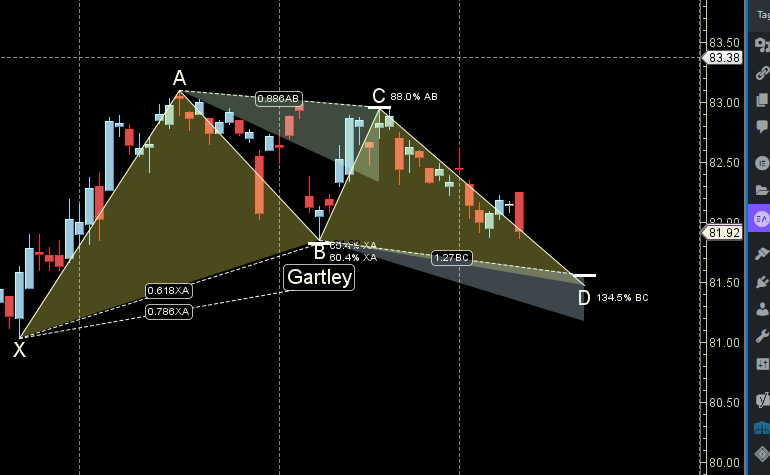
Price is heading towards 81.50 to complete GARTLEY pattern.