


Foreign Institutional Investors (FII) showed a Bullish approach in the Index Futures market by Buying 24420 contracts worth 2193 crores, resulting in an decrease of 11098 contracts in the Net Open Interest. FIIs bought 6661 long contracts and covered 17759 short contracts, indicating a preference for BUYING new positions. With a Net FII Long Short ratio of 0.39, FIIs used the market rise to enter long and exit short positions in Index Futures.
As Discussed in Last Analysis Price continues to hold resistance at 1×1 Gann angle, and with Venus Ingress happening tomorrow, which may lead to a trend change. The activation of 3 Bayer’s Rule is also anticipated. For intraday traders, the first 15 minutes’ high and low will serve as a guide.
“Bayer Rule 14: Venus movements in geocentric longitude using a unit of 1*9’13”.”
“Bayer Rule 27: Big tops and big major bottoms occur when Mercury’s speed in geocentric longitude is 59 minutes or 1 degree 58 minutes.”
“Rule No. 38: Mercury latitude heliocentric. Some significant tops and bottoms are produced when Mercury passes the above-mentioned degrees in this motion
Price continue to make Higher High today is 7 day Nifty is up. 7 and 9 are important Numner in Gann so next 2 days are crucial for market Price has close above 1×2 Gann angle which is a bullish sign till we are holding 17655 which is today;s Low. As we had multiple astro date today so till today low is Held Bulls have upper hand.

Traders may watch out for potential intraday reversals at 9:42,11:05,12:38,1:46,2:15How to Find and Trade Intraday Reversal Times
Nifty has Formed another NR7 pattern today The NR7 pattern stands for “Narrow Range 7” and is a unique price pattern that indicates a period of low volatility in the market. It is identified when the range of the current trading day is the narrowest compared to the range of the previous 6 trading days. In other words, the highest high and lowest low of the current day’s candlestick are within the highest high and lowest low of the previous 6 candlesticks.
As per NR7 Pattern Long should be taken above 17750 for a move towards 17795/17842/17889. Bears will get active below 17655 for a move towards 17608/17561/17514

Nifty April Futures Open Interest Volume stood at 0.93 lakh, witnessing a liquidation of 4.8 lakh contracts. Additionally, the decrease in Cost of Carry implies that there was a closure of longs positions today.
Nifty options chain shows that the maximum pain point is at 17750 and the put-call ratio (PCR) is at 0.98 . Typically, when the PCR open interest ranges between 0.90 and 1.05, the market tends to remain range-bound. This suggests that Nifty may trade within a range of 17600-17800 levels in the near term.
According To Recent Data, Retailers Have sold 708457 Call Option Contracts and Covered 442342 CALL Option Contracts. Additionally, They Bought 580038 Put Option Contracts And Added 364462 Shorted Put Option Contracts, Indicating A Bearish Outlook.
In Contrast, Foreign Institutional Investors (FIIs) sold 14435 Call Option Contracts And Shorted 57101 Call Option Contracts. On The Put Side, FIIs Bought 61979 Put Option Contracts And Shorted 151624 Put Option Contracts, Suggesting They Have Turned To A Bullish Bias.
Nifty 50 Options Chain Analysis
The Nifty 50 options chain indicates that the highest open interest (OI) on the call side is at the 17,700 strike, followed by 17,800 strikes. On the put side, the highest OI is at the 17500 strike, followed by 17400 strikes. This suggests that the market participants are expecting Nifty 50 to remain range between 17500-17700 levels.
In the cash segment, Foreign Institutional Investors (FII) bought 342 crores, while Domestic Institutional Investors (DII) sold 264 crores.
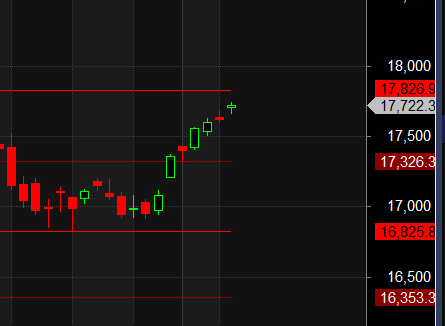
Traders who follow the musical octave trading path may find valuable insights in predicting Nifty’s movements. According to this path, Nifty may follow a path of 16825-17326-17826. This means that traders can take a position and potentially ride the move as Nifty moves through these levels.
Of course, it’s important to keep in mind that trading is inherently risky and market movements can be unpredictable. Low made was 16828 now heading towards 17826 till closing above 17326
The Market Doesn’t Give a Damn What You Think, about your economic or political views. Trade what the market is doing, not what you’d like it to do in your wildest fantasies.
For Positional Traders, The Nifty Futures’ Trend Change Level is At 17519. Going Long Or Short Above Or Below This Level Can Help Them Stay On The Same Side As Institutions, With A Higher Risk-reward Ratio. Intraday Traders Can Keep An Eye On 17766 , Which Acts As An Intraday Trend Change Level.
PCR open interest ranges between 0.90 and 1.05, the market tends to remain range-bound. This suggests that Nifty may trade within a range of 17300-17500 levels in the near term.****
17300-17500?
Is it correct or typo error?
Can you please confirm?
For me and I am sure for many of us, your prediction is like a verdict….. It’s pretty accurate in most of the times….
Please clarify….
apologies its 17600-17800