


MCX Gold is one of the most traded commodities in the Indian stock market. As an investor, keeping an eye on the weekly analysis of MCX Gold can help you make informed decisions and maximize your returns. In this article, we will provide a comprehensive analysis of MCX Gold’s weekly trends and patterns, along with tips to help you Trade wisely.The report covers a wide range of topics, including Gann Harmonic and Astro Analysis.
MCX Gold is a commodity that is traded on the Multi Commodity Exchange (MCX) in India. The price of MCX Gold is influenced by a variety of factors, such as global economic conditions, geopolitical tensions, and supply and demand. Understanding these factors and their impact on MCX Gold’s price can help traders make informed decisions.
MCX GOLD Gann Angle Chart
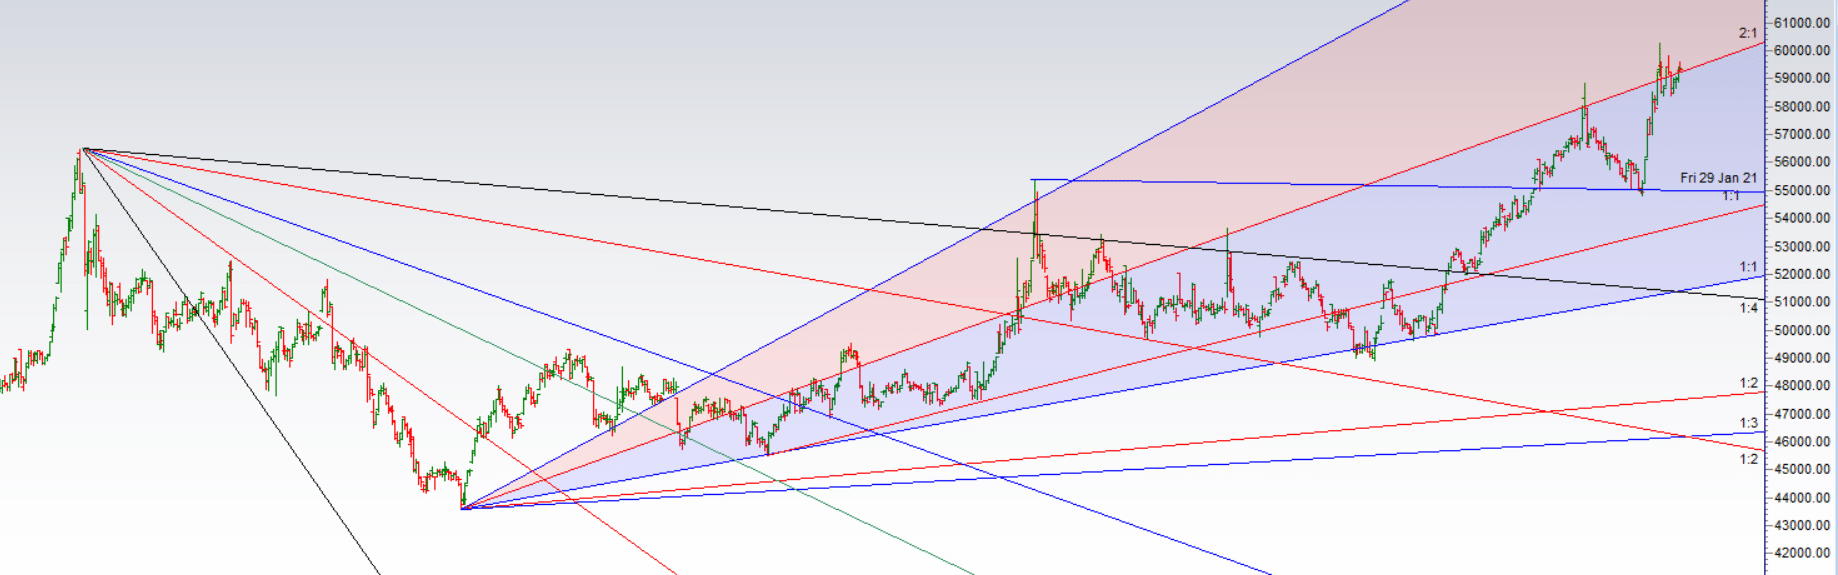
MCX Gold has done its target of 1×1 line can see pullback towards 58500-58000.
MCX GOLD Astrology Support and Resistance Line

MCX Gold has reacted from SUN Plannetary resistance line.
MCX GOLD Harmonic Analysis
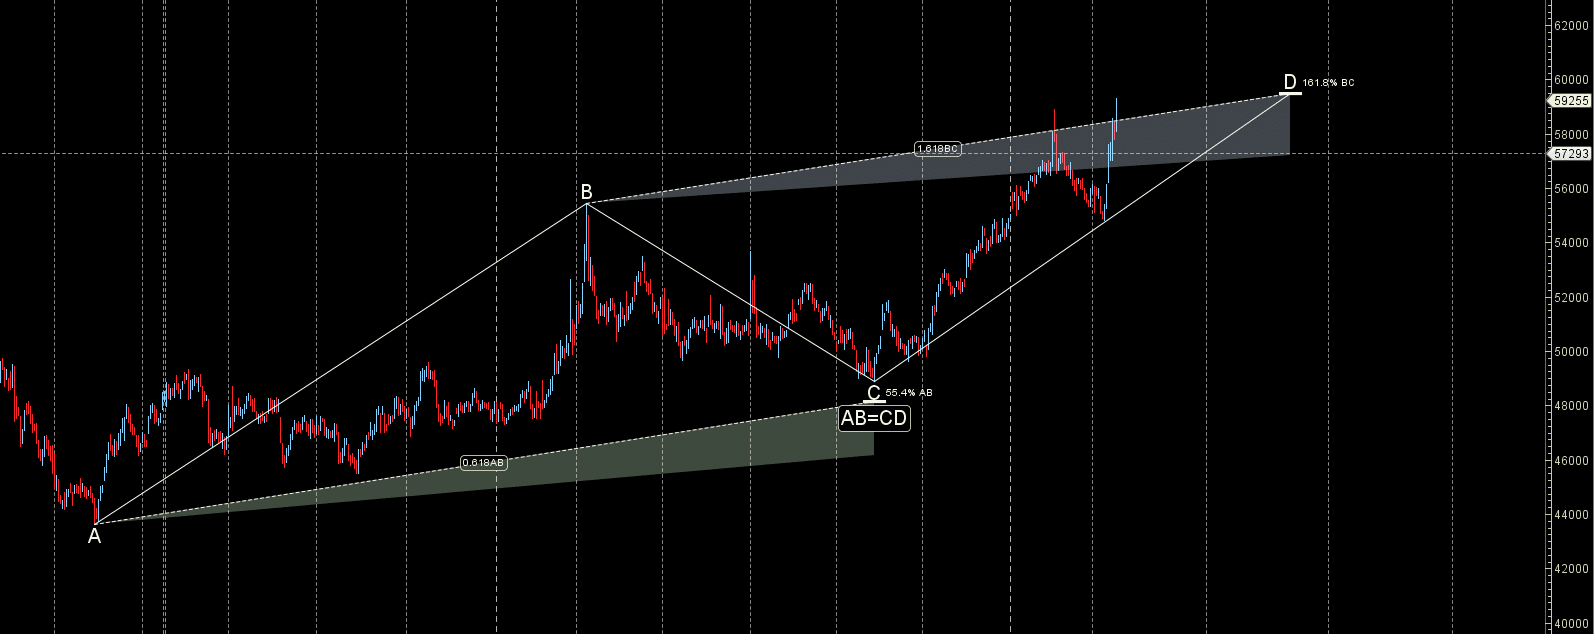
Price has completed ABCD pattern