


Foreign Institutional Investors (FII) showed a Bullish approach in the Index Futures market by Buying 11184 contracts worth 1014 crores, resulting in a increase of 5736 contracts in the Net Open Interest. FII’s covered 8460 long contracts and covered 2724 short contracts, indicating a preference for Buying new positions. With a Net FII Long Short ratio of 0.12 FII used the market rise to enter long and exit short positions in Index Futures.
Yesterday, the Nifty formed an NR7 pattern, and today is the Pluto Ingress, which is occurring almost after 10 years. The price is forming higher highs until yesterday’s low of 17107, which is held, indicating an upward trend.
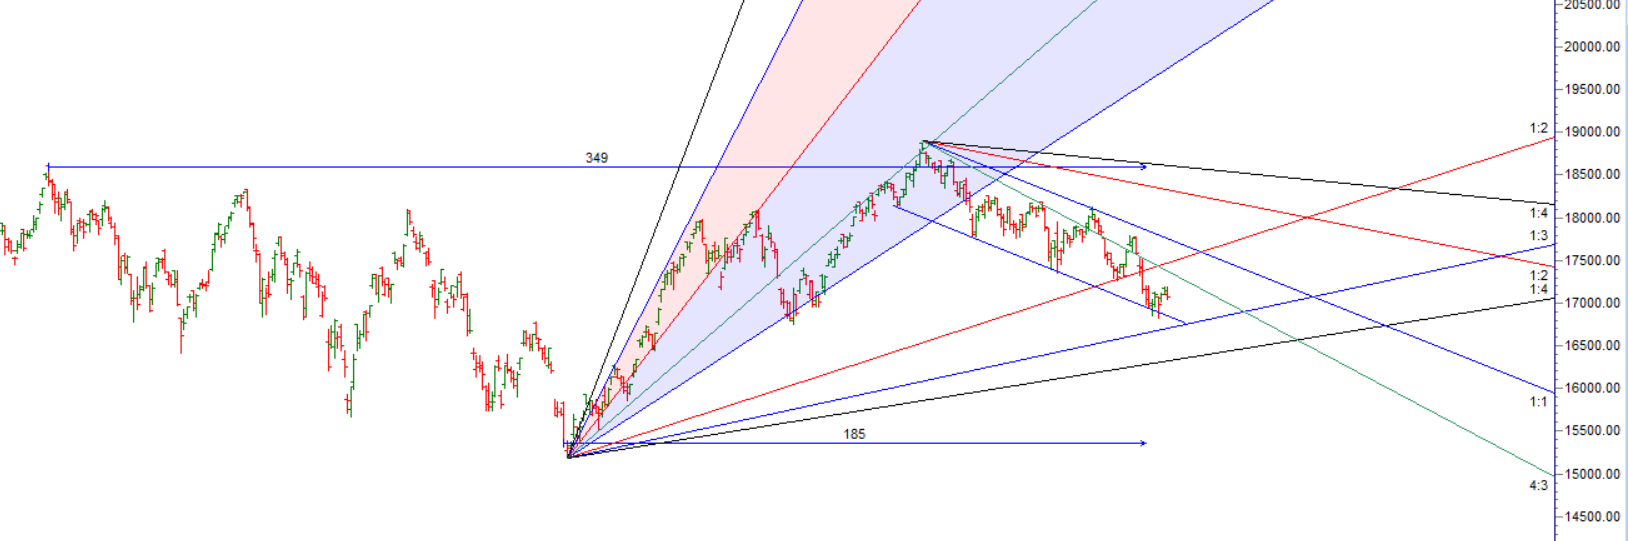
The Nifty index has formed a double top pattern on the daily chart, indicating a potential bearish trend reversal. This pattern occurs when the price hits a resistance level twice, but fails to break through it, and subsequently falls below a support level.
The first top was formed on March 22nd, when the Nifty index reached a high of 17207.3, and the second top was formed on March 23rd, with the index hitting a high of 17205. Since then, the index has been showing weakness and has fallen below the support level of 17108.
The double top pattern is a reliable indicator of a bearish trend reversal, and traders should be cautious in their trading decisions. But if Nifty close above 17210 we could see a invalidation of the pattern.
March 24, 2020, Nifty formed the COVID bottom 7511 , so tomorrow is an important time cycle day. The first 15 minutes’ high and low will guide the day
Swing traders can expect a potential move towards 17217, 17282, 17347 if the market trades above 17152. However, if the market falls below 17022 , bears may become more active, leading to a move towards 16958,16893,16828

Traders may watch out for potential intraday reversals at 9:15,10:48,11:45,12:16,1:35, 2:53. How to Find and Trade Intraday Reversal Times
Nifty March Futures Open Interest Volume stood at 1.16 lakh, witnessing a addition of 0.91 lakh contracts. Additionally, the increase in Cost of Carry implies that there was a closeure of short positions today.
Nifty options chain shows that the maximum pain point is at 17200 and the put-call ratio (PCR) is at 0.82. Typically, when the PCR open interest ranges between 0.90 and 1.05, the market tends to remain range-bound. This suggests that Nifty may trade within a range of 16900-17200 levels in the near term
Nifty 50 Options Chain Analysis
The Nifty 50 options chain indicates that the highest open interest (OI) on the call side is at the 17,200 strike, followed by 17,300 strikes. On the put side, the highest OI is at the 17000 strike, followed by 16900 strikes. This suggests that the market participants are expecting Nifty 50 to remain range between 16900-17200 levels.
In the cash segment, Foreign Institutional Investors (FII) sold 995 crores, while Domestic Institutional Investors (DII) bought 1668 crores.
Traders who follow the musical octave trading path may find valuable insights in predicting Nifty’s movements. According to this path, Nifty may follow a path of 16825-17326-17826. This means that traders can take a position and potentially ride the move as Nifty moves through these levels.
Of course, it’s important to keep in mind that trading is inherently risky and market movements can be unpredictable. Low made was 16828 now heading towards 17326

I know it may sound strange to many readers, but there is an inverse relationship between analysis and trading results. More analysis or being able to make distinctions in the market’s behaviour will not produce better trading results– Mark Douglas
For Positional Traders, The Nifty Futures’ Trend Change Level is At 17381. Going Long Or Short Above Or Below This Level Can Help Them Stay On The Same Side As Institutions, With A Higher Risk-reward Ratio. Intraday Traders Can Keep An Eye On 17087, Which Acts As An Intraday Trend Change Level.