


Foreign Institutional Investors (FII) showed a Bearish approach in the Index Futures market by Selling 874 contracts worth 129 crores, resulting in a decrease of 76 contracts in the Net Open Interest. FII’s sold 475 long contracts and added 399 short contracts, indicating a preference for short selling on exisiting positions. With a Net FII Long Short ratio of 0.09 ,lowest in last 6 years FII used the market rise to exit long and enter short positions in Index Futures.
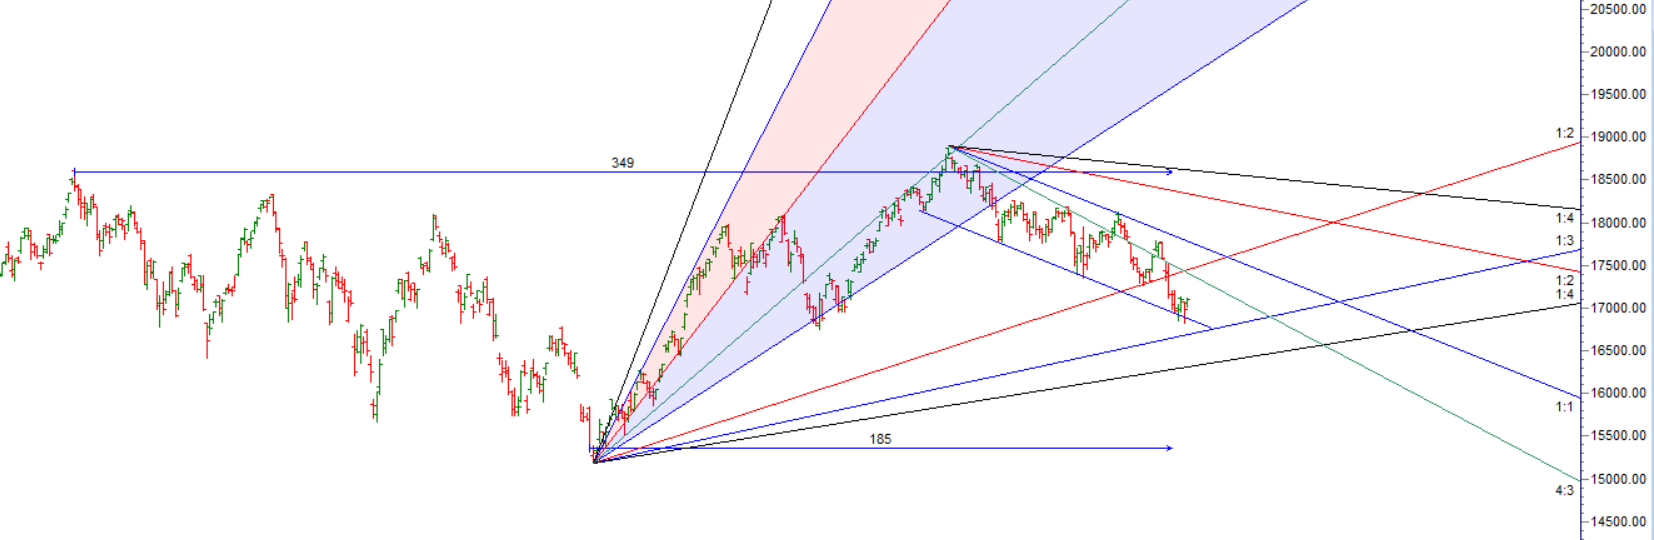
Nifty closed above the Gann angle Bulls were able to close above 17070 to confirm a bottom. Today we have 3 Important Astro Event
- Jupiter semi-square Saturn
- Vernal Equinox — W. D. Gann tracked each year as an important astro-trading pivot point.
- New Moon
- Gann Natural Time Cycle date
Jupiter semi-square Saturn is an astrological aspect that occurs when Jupiter is halfway between a square and a conjunction with Saturn. This aspect represents a tense and challenging energy between expansion (Jupiter) and contraction (Saturn). It is said to symbolize a time of testing, when there may be obstacles and limitations that need to be overcome in order to achieve success.
A new moon occurs when the moon is in conjunction with the sun, and its illuminated side is facing away from the Earth. It is considered a time of new beginnings, fresh starts, and setting intentions for the future.
As Multiple Astro and Gann Cycle are meeting with Price above 17070 we can see upmove with levels mentioned as below.
Astrology and Gann cycles are two different approaches to analyzing the stock market, but they are not mutually exclusive. In fact, there is a significant overlap between the two, and many traders use both approaches to make trading decisions. As we have discused below video as both astro and gann cycle combined we got the big move. Now we need a close above 1760-17190 for rally to continue further towards 17400-17424 range where 200 DMA lies. We have FOMC meet tonight so carry overnight positions with Hedge.
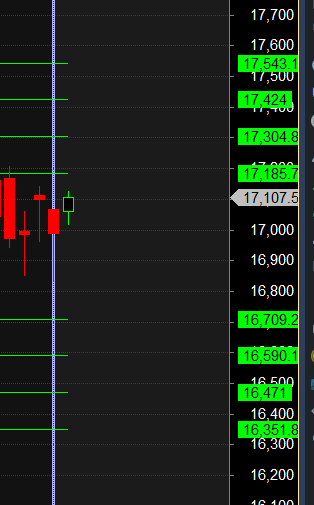
Swing traders can expect a potential move towards 17185, 17304, or 17424 if the market trades above 17070. However, if the market falls below 16825 , bears may become more active, leading to a move towards 16709,16590– Now waiting for target of 17185, 17304, or 17424 till Nifty is above 17070
Traders may watch out for potential intraday reversals at 9:15,10:55,11:49, 1:42, 2:52 How to Find and Trade Intraday Reversal Times
Nifty March Futures Open Interest Volume stood at 1.22 lakh, witnessing a addition of 0.34 lakh contracts. Additionally, the increase in Cost of Carry implies that there was a closeure of short positions today.
Nifty options chain shows that the maximum pain point is at 17100 and the put-call ratio (PCR) is at 0.95 . Typically, when the PCR open interest ranges between 0.90 and 1.05, the market tends to remain range-bound. This suggests that Nifty may trade within a range of 16900-17200 levels in the near term
Nifty 50 Options Chain Analysis
The Nifty 50 options chain indicates that the highest open interest (OI) on the call side is at the 17,200 strike, followed by 17,300 strikes. On the put side, the highest OI is at the 17000 strike, followed by 16900 strikes. This suggests that the market participants are expecting Nifty 50 to remain range between 16900-17200 levels.
According to Yesterday data, retailers have sold 600017 call option contracts and 440243 shorted Call option contracts were covered . Additionally, they bought 298880 put option contracts and added 149781 shorted put option contracts, indicating a Bearish outlook.
In contrast, foreign institutional investors (FIIs) bought 67584 call option contracts and 6934 shorted call option contracts were covered . On the put side, FIIs bought 18159 put option contracts and shorted 82495 7 put option contracts, suggesting they have turned to a BUllish bias.
In the cash segment, Foreign Institutional Investors (FII) sold 1454 crores, while Domestic Institutional Investors (DII) bought 1946 crores.
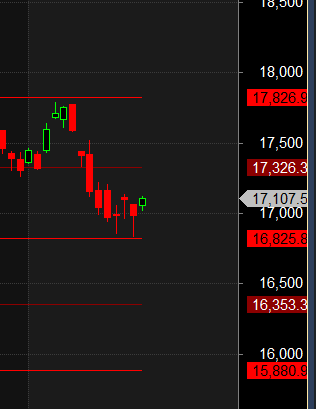
Traders who follow the musical octave trading path may find valuable insights in predicting Nifty’s movements. According to this path, Nifty may follow a path of 16825-17326-17826. This means that traders can take a position and potentially ride the move as Nifty moves through these levels.
Of course, it’s important to keep in mind that trading is inherently risky and market movements can be unpredictable. Low made was 16828 now heading towards 17326
“To be a successful trader, you have to be able to admit mistakes. People who are very bright don’t make very many mistakes. They don’t make very much money.” – William O’Neil
For Positional Traders, The Nifty Futures’ Trend Change Level is At 17404 . Going Long Or Short Above Or Below This Level Can Help Them Stay On The Same Side As Institutions, With A Higher Risk-reward Ratio. Intraday Traders Can Keep An Eye On 17117 , Which Acts As An Intraday Trend Change Level.