


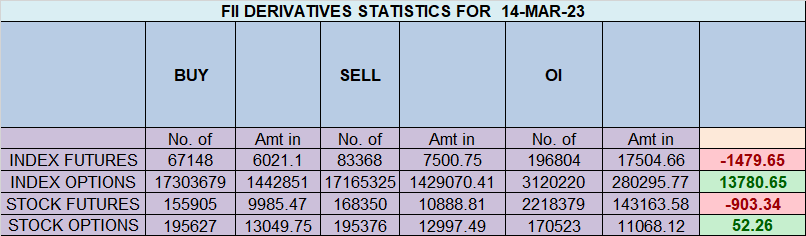
Foreign Institutional Investors (FII) showed a Bearish approach in the Index Futures market by Selling 16.2 K contracts worth 1479 crores, resulting in a increase of 8.4 K contracts in the Net Open Interest. FII’s bought 4523 long contracts and added 8637 short contracts, indicating a preference for Short positions. With a Net FII Long Short ratio of 0.18 , FII used the market fall to enter long and enter short positions in Index Futures.
Nifty correction may be unsettling for traders as we have seen fall of 532 points in just 5 trading sessions. As traders, it’s important to stay calm during market corrections and not panic. Corrections can present great buying opportunities for those who have a long-term view of the market. It’s also important to have a solid trading plan in place and to stick to your strategy.
In the world of trading, there are certain Astro rules that traders follow to gain insights into market trends and potential reversals. Today, we’re highlighting two important Bayer rules that traders should keep in mind.
Bayer Rule 15 states that by analyzing the position of Venus relative to the Sun, traders can gain insights into major market moves and potential reversals. Specifically, traders should pay attention to Venus Heliocentric Latitude at extreme and least speeds, as these can indicate significant changes in market direction.
Rule No. 38 focuses on Mercury Latitude Heliocentric, which can also provide valuable insights for traders. When Mercury is in motion and passes certain degrees, it can produce powerful tops and bottoms in the market.
By understanding these rules and analyzing the movements of Venus and Mercury, traders can make more informed trading decisions and potentially profit from major market moves.
In conclusion, it’s important for traders to keep an eye on celestial movements and pay attention to these important Bayer rules. By doing so, they can gain a deeper understanding of market trends and potentially make profitable trades.
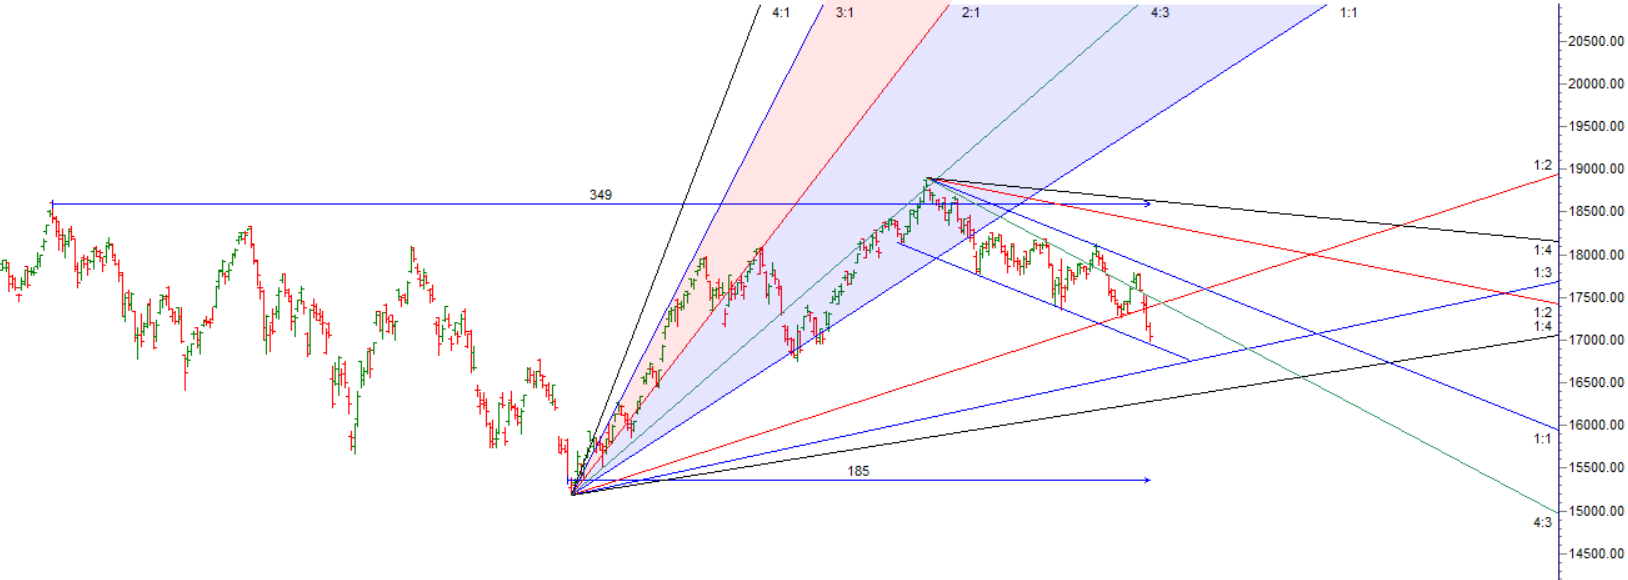
Swing traders can expect a potential move towards 17331, 17462, or 17555 if the market trades above 17233. However, if the market falls below 16978 , bears may become more active, leading to a move towards 16880,16750

Traders may watch out for potential intraday reversals at 09:35,11:20, 12:10, 1:05, 2:03 and 2:47. How to Find and Trade Intraday Reversal Times
Nifty March Futures Open Interest Volume stood at 1.23 lakh, witnessing a addition of 7.2 lakh contracts. Additionally, the increase in Cost of Carry implies that there was a addition of short positions today.
Nifty options chain shows that the maximum pain point is at 17200 and the put-call ratio (PCR) is at 1.05. Typically, when the PCR open interest ranges between 0.90 and 1.05, the market tends to remain range-bound. This suggests that Nifty may trade within a range of 17100-17400 levels in the near term
Nifty 50 Options Chain Analysis
The Nifty 50 options chain indicates that the highest open interest (OI) on the call side is at the 17,300 strike, followed by 17,400 strikes. On the put side, the highest OI is at the 17000 strike, followed by 16900 strikes. This suggests that the market participants are expecting Nifty 50 to remain range between 17000-17400 levels.
In the cash segment, Foreign Institutional Investors (FII) sold 3086 crores, while Domestic Institutional Investors (DII) bought 2121 crores.
Traders who follow the musical octave trading path may find valuable insights in predicting Nifty’s movements. According to this path, Nifty may follow a path of 16825-17326-17826. This means that traders can take a position and potentially ride the move as Nifty moves through these levels.
Of course, it’s important to keep in mind that trading is inherently risky and market movements can be unpredictable.

“To be a successful trader, you have to be able to admit mistakes. People who are very bright don’t make very many mistakes. They don’t make very much money.” – William O’Neil
For Positional Traders, The Nifty Futures’ Trend Change Level is At 17530 . Going Long Or Short Above Or Below This Level Can Help Them Stay On The Same Side As Institutions, With A Higher Risk-reward Ratio. Intraday Traders Can Keep An Eye On 17155 , Which Acts As An Intraday Trend Change Level.
SIr, Is this Long/Short correct number of contracts correct ? Not tallying … Is it possible Longs liquidated and more Shorts added…