


Wishing Dear Readers a very very happy and prosperous and profitable new Year.
New Year Goals and Resolutions Ideas for Traders
2018 year started with a rally from Bottom based on Gann Price Time Squaring we formed on Gujarat Election day Made Top on 29 Jan again Important time cycle date when both Gann Price and Time Squaring happened and we corrected 1000 points and bottomed on 23 March very Important Astro date as Mercury changed its speed Nifty staged a spectacular rally all the way till 11760 we saw a Big reversal and fall till 10004, Bottom we captured as per our Astro Analysis on 27 Oct. Nifty clocking a gain of 3.5 % in 2018. We can consider 2019 as year of consolidation after Big Rally we saw in 2017. Big Pain of 2018 was the destruction in wealth seen in Small and Mid Caps where many Mid Caps turned into Small Caps and Small Caps into Penny Stocks, Expect some good move in coming year as we approach the Election Year. Monthly and Yearly chart of Nifty are shown below.
Yearly Chart
Yearly chart have formed an Spinning Top candlestick
A Spinning Top indicates a strong fight going on between the bears and the bulls. The bulls are giving it their all, as are the bears. Nobody has won the fight yet, so the candle closes near to its open price.Open of Nifty was 10531 and Close was 10852.

If a Spinning Top appears during a bullish trend it suggests that the bulls could be losing control, and the trend could be ending. This is because until the spinning top formed the bulls had a very strong bullish trend. The spinning top suggests to traders that the bears are fighting back and the bulls are struggling to continue the bullish trend.
Bulls should hold 10600 on Monthly closing basis and Bears should see Close below 10531 for Spinning Top Candle to show its effect.
Monthly Gann Chart
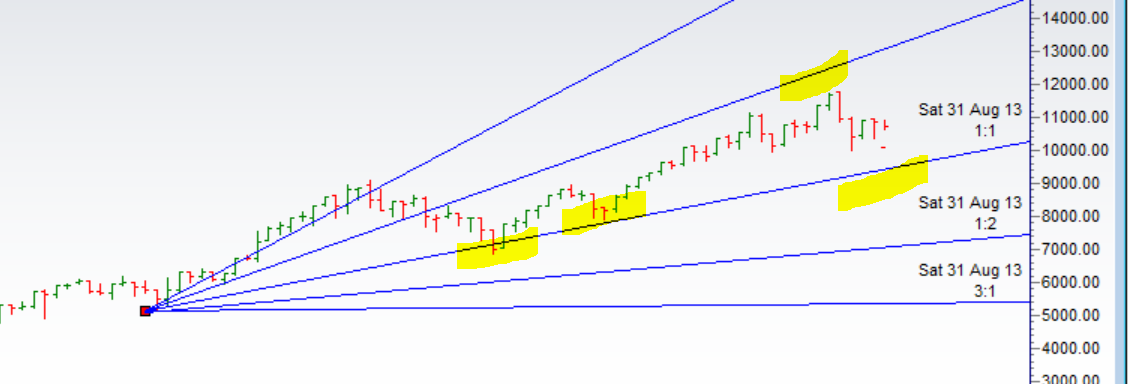
Monthly Chart with Gann Angles is shown Breakdown below 9828 for a move till 9600/9300/9100. Breakout above 11100 for a move towards 11600/11800/12100.
Monthly Chart with Supply and Demand Zone
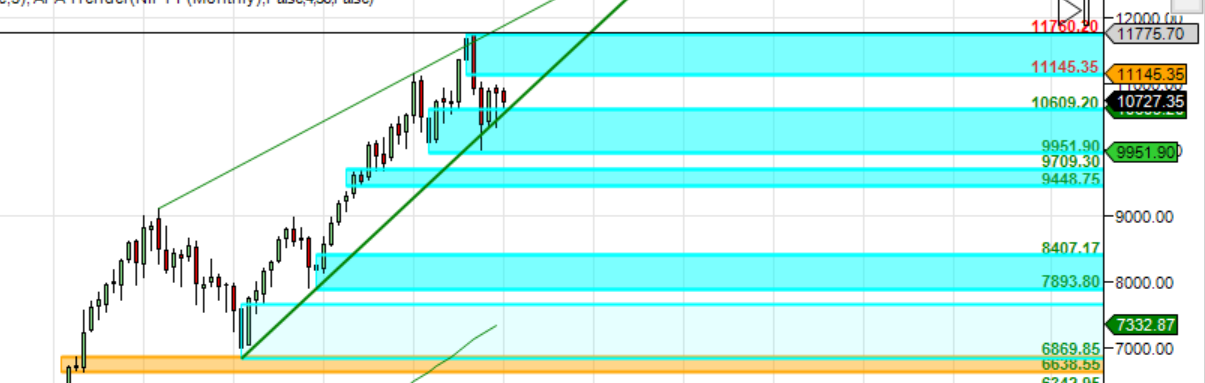
Monthly Trend line Support at 10610 break of that can see fall towards 10400/10000-9951. Upper End Support comes at 11145/11760
Important Dates as per Time Analysis :
Below dates can see Trend Change in Market.
02-01-2019
08-01-2019
17-01-2019
25-01-2019
10-02-2019
19-02-2019
05-03-2019
22-03-2019
10-04-2019
29-04-2019
02-05-2019
22-05-2019
24-06-2019
23-07-2019
18-08-2019
30-08-2019
05-09-2019
19-09-2019
01-10-2019
25-10-2019
14-11-2019
09-12-2019
26-12-2019
Nifty Yearly Trend Change:10985
Nifty Yearly Resistance:11359,11764,12100,12666
Nifty Yearly Support:10530,10364,10100,9820,9600,9410,9100
Click Here to Like Facebook Page get Real time updates
Follow on Twitter during Market Hours: https://twitter.com/brahmesh
Thanks Bramesh Sir for yrly nifty levels 2019
We would be highly obliged , if you could also give us similar yearly figures for Bank nifty, if possible , from your busy schedule