


Infosys
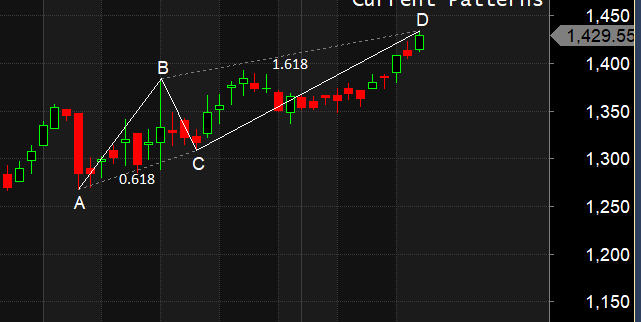
Positional Traders can use the below mentioned levels
Close below 1422 Target 1400/1378
Intraday Traders can use the below mentioned levels
Buy above 1435 Tgt 1444,1453 and 1462 SL 1427
Sell below 1422 Tgt 1415,1402 and 1390 SL 1427
M&M Finance

Positional Traders can use the below mentioned levels
Close above 476 Target 488/500
Intraday Traders can use the below mentioned levels
Buy above 476 Tgt 480,484 and 488 SL 472
Sell below 470 Tgt 465,460 and 455 SL 474
REC
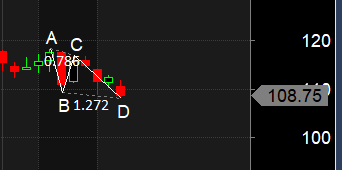
Positional Traders can use the below mentioned levels
Close above 110 Target 116
Intraday Traders can use the below mentioned levels
Buy above 110 Tgt 111.2,113.3 and 114.4 SL 109
Sell below 108 Tgt 107.1,106 and 105 SL 109
How to trade Intraday and Positional Stocks Analysis — Click on this link
Performance sheet for Intraday and Positional is discussed for July Month, Intraday Profit of 5.09 Lakh and Positional Profit of 5.45 Lakh. Please note we do not have any “ADVISORY Service”, I share this sheet to see how the system are performing and money can be made in Stock Market if Trading Systems are followed with discipline. Performance “Will differ” from trader to trader.
http://tradingsystemperformance.blogspot.in/
http://stockpositionaltrading.blogspot.in/
- All prices relate to the NSE Spot/Cash Market
- Calls are based on the previous trading day’s price activity.
- Intraday call is valid for the next trading session only unless otherwise mentioned.
- Stop-loss levels are given so that there is a level below/above, which the market will tell us that the call has gone wrong. Stop-loss is an essential risk control mechanism; it should always be there.
- Book, at least, part profits when the prices reach their targets; if you continue to hold on to positions then use trailing stops to lock in your profits.
Follow on Facebook https://www.facebook.com/Brameshs-Tech-14011718268586