


Last Week we gave Chopad level of 7441, Nifty did all 3 target on upside rewarding trend follower with 200 points. Using the Golden Ratio we were able to predict the Top of Nifty around 7800 Can Nifty form short term top around 7800 ? Lets analyze how to trade Nifty in next week.
Nifty Hourly Chart

Hourly charts shows strong support in range of 7600-7610. Holding the same we can see a bounceback till 7800 odd levels.
Nifty Elliot Wave Analysis

As per Elliot wave Theory B wave on hourly charts can get over near 7700-7731 levels and pulback till 7522 odd levels.
Nifty Daily Chart

Nifty is near the gann box resistance line closing above the same 7731/7800 becomes the target.
Nifty Daily Elliot Wave Chart
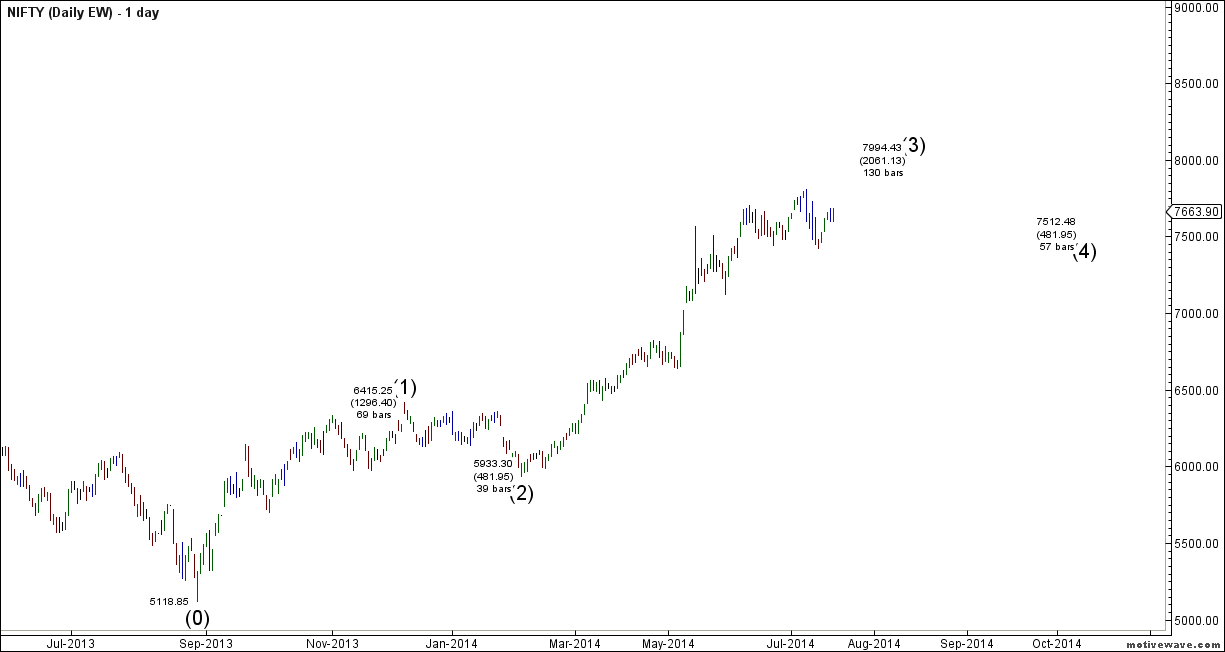
Daily chart are still trading in 3 Wave and dips till 7422 needs to be bought into.
Nifty Gann Date

21 July +/1 days is gann turn date and explosive move is round the corner. Last week we gave date of 17 July +-1 date and we saw explosive upmove on 16 July.
Nifty Gaps
For Nifty traders who follow gap trading there are 7 trade gaps in the range of 5300-6400
- 7067-7014
- 7130-7121
- 7276-7293
- 7229-7239
- 7454-7459
- 7526-7532
Fibonacci technique
Fibonacci fan

As discussed last week As per Gann Fans Nifty has taken support at gann trendline holding the same will be bullish for initial target of 7600.On Downside strong support in range of 7385-7400 if broken can see downside till 7200 as shown in above chart.
Nifty Fibo Retracement

7532 which are 23.6 retracement should be watched closely in coming week.
Nifty Weekly Chart
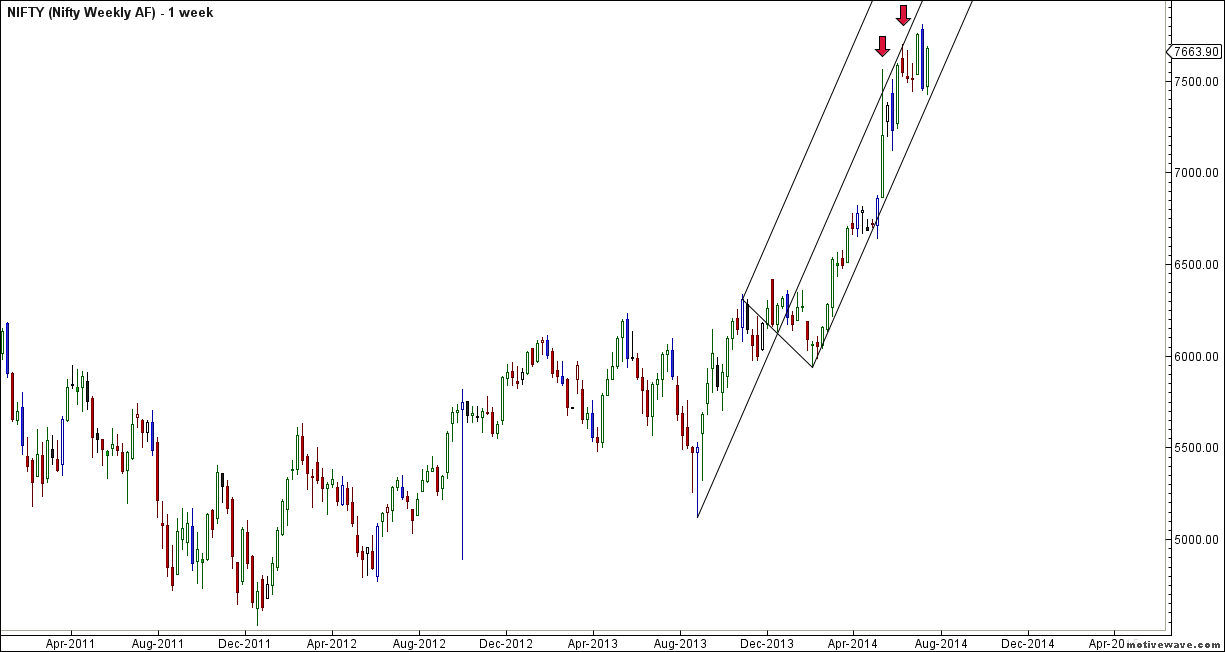
It was positive week, with the Nifty up by 204 points closing @7664.This is what we mentioned last week Weekly charts are also showing strong support in range of 7400-7380 use these level to exit shorts. Now Nifty is its Andrew Pitchfork median line and unable to cross the same pullback can start, Also nifty will be entering a new quadrant from next week as per time analysis and need to be extreme cautious on longs now.

Trading Monthly charts

Monthly chart gives a target of 8023 for short term as per Fibo ratio theory
Nifty Weekly Chopad Levels
Nifty Trend Deciding Level:7685
Nifty Resistance:7758,7847,7901
Nifty Support:7640,7590, 7495
Levels mentioned are Nifty Spot
Let me go by Disclaimer these are my personal views and trade taken on these observation should be traded with strict Sl
Want to see post in your Inbox,Register by adding your email id in Post in your Inbox section
Follow on Facebook during Market Hours: https://www.facebook.com/pages/Brameshs-Tech/140117182685863
bramesh sir. i want to know about gann time. can u tell me every thing about it
Hi Bramesh, Thank you for detailed analysis. I have two questions –
1. Under ‘Nifty Gann Date’ it is given that on 17th there was a explosive move. What is meant by explosive move? If I understand it as a big move, on 16th there was a big move than on 17th. 16th trade range is bigger than 17th.
2. Under Gap theory it is mentioned that ‘For Nifty traders who follow gap trading there are 7 trade gaps in the range of 5300-6400’. But the gaps listed are 6 and the range is current one. Is this a typo mistake?
Thank you again!!
Thanks Vijay Corrected the Typo Error.
Rgds,
Bramesh
Thank you for the nifty analysis…. great insight ☺
Thanks Anand.
Rgds,
Bramesh