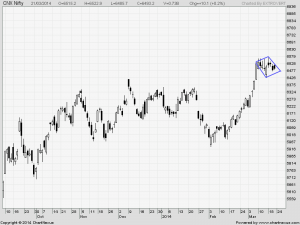
Nifty Hourly Chart
Nifty Hourly charts has closed below its 50 HDMA, which is bearish in short term.Any close above 6510 will bring back bullishness in market.
Nifty Daily Chart
Nifty after breaking out of 6410 range last week, consolidated its gains in last week. Now range of 6357-6410 becomes an important support of market. Nifty has formed multiple resistance in range of 6562-6575 range,unable to cross the same we can see a dip towards 6357-6400 odd levels.Diamond pattern is also forming with breakdown below 6430 and breakout above 6575.
Nifty Gaps
For Nifty traders who follow gap trading there are 7 trade gaps in the range of 5300-6400
- 5285-5303
- 5448-5553
- 5680-5700
- 5780-5802
- 6091-6108
- 6328-6339
- 6401-6413
Fibonacci technique
Fibonacci fan
 Nifty Fibonacci fan are wonderful tool to find the top and bottom in short term.Nifty is trading at its fibo fan resistance, unable to cross 6575 in coming week we can see a pullback to 6350 odd levels.
As per Fibo retracement ,nifty closed was unable to cross its 138.2% and 150% fibo extension, which is a bearish sign in short term,Any close below 6470 next big support comes at 6430 and 6357 odd levels.
Nifty Weekly Chart
It was neutral week, with the Nifty down by 11 points closing @6494. Nifty is again taking resistance at its rising trendline also forming a DOJI/spinning top candlestick which are bearish in nature but need a follow up action with a break below 6457 on closing basis.
Trading Monthly charts
Monthly chart has shown breakout and holding 6357 holds the key.
Nifty Trading Levels
Nifty Trend Deciding Level:6501
Nifty Resistance:6562,6630,6700
Nifty Support:6460,6410 and 6357
Levels mentioned are Nifty Spot
Let me go by Disclaimer these are my personal views and trade taken on these observation should be traded with strict Sl
Want to see post in your Inbox,Register by adding your email id in Post in your Inbox section
Follow on Facebook during Market Hours: https://www.facebook.com/pages/Brameshs-Tech/140117182685863


